
Table of Contents
While some specialty chemicals companies are unfortunately in “freeze” mode during these times of economic and geopolitical uncertainty, others are rightly focusing on strategies to optimize their operations as a path toward enhancing long-term profitability. One ripe target in many organizations is overall equipment effectiveness (OEE), which compares your operation’s ideal performance to its overall real performance.
Minor improvements in operations OEE can make a major difference to overall total productive maintenance (TPM), the goal of which is to maximize your equipment’s efficiency and minimize downtime. OEE is a quantifiable way to evaluate how well your equipment, people, and processes are working by measuring:
- Available time divided by uptime – availability
- Production/output speed and consistency – performance
- Number of defects – quality
OEE uses these data points to determine a percentage of good production time for each asset. The resulting OEE scores enable you to use sub-level information to address opportunities for improvement.
Common Loss Drivers
Equipment productivity loss in manufacturing is caused by several common factors relating to the previously noted availability, performance, and quality (see Table 1). Identifying and focusing on the most common losses in your organization creates a clear path to improving your OEE score and optimizing efficiencies.
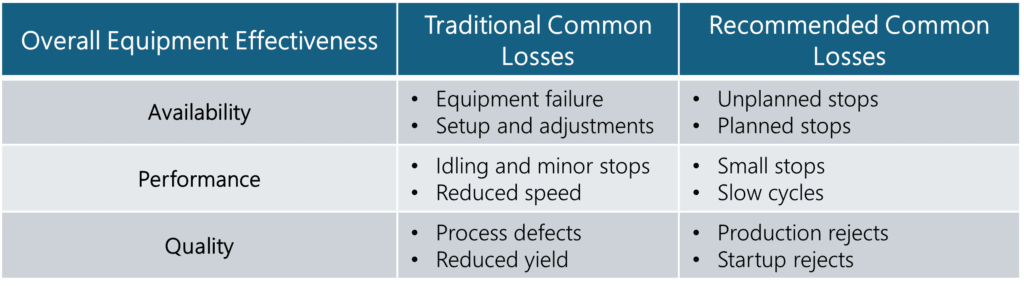
Availability Loss
Working to reduce availability loss due to equipment failures or setups/adjustments protects against preventable unplanned downtime while minimizing unplanned stops.
Equipment failure accounts for any significant period in which equipment is scheduled for production but is not running due to failure (i.e., unplanned stoppage or downtime). Some common examples of equipment failure are machine breakdowns, improper setup, and unplanned maintenance. From the broader perspective of unplanned stops, additional causes might include a lack of operators or materials, the process being choked by upstream equipment, or downstream equipment causing blockages. Proven control plans should be put in place to reduce or eliminate equipment failure.
Setup and adjustments account for any significant period in which equipment is scheduled for production but is not running due to changeovers or other adjustments to equipment. Some common reasons for setups and adjustments might be product-to-product equipment modifications, product changeovers not being optimal, or unplanned maintenance.
Production schedulers should target customers’ satisfaction as well, meeting on time and full delivery related to production and efficiency costs where production campaigns are maximized. It is important to reach an equilibrium, if possible, between the service level that you provide to the customer and the associated costs. Be sure to take into consideration the overall impact on the production scheduling and planning aspect, especially with changeovers.
Performance Loss
Addressing performance loss that results from idling and minor stops, as well as reductions in speed, prevents small stops and slow cycles from accumulating. When we consider idling and minor stops, we generally include short (under 5 minutes) stops that occur while the operator resolves an issue without the help of maintenance. While short in duration, the root causes are often chronic here, which can make operators somewhat blind to the full impact.
Some examples of idling and minor stops might be raw material disruptions, plugged transfer lines, incorrect operator parameters or work instructions, improper calibrations, or design issues. Sometimes, the operator may need to locate ancillary equipment that is not stored in the right place or isn’t easily accessible.
While performance-related issues may appear small in magnitude, they add up when multiple occurrences happen. Most companies not embedded in a robust continuous improvement culture tend to ignore the full impact of these types of issues. While these stops might be only a few minutes in a single duration, they accumulate and can make a significant difference over the course of your production cycle.
Another factor in performance loss is reduced speed. Also known as slow cycles, reduced speed includes anything that keeps the process from running at its theoretical maximum speed (sometimes referred to as ideal run rate or nameplate capacity). Causes can include poor maintenance, substandard raw materials, limited ancillary equipment, poor environmental conditions in the plant, operator inexperience, or general lack of operator training.
Quality Loss
Minimizing quality loss in the form of process defects and lower yield reduces the number of unusable products produced during steady production.
Process defects can account for defective material produced as off-spec batches or from startup until steady-state production is reached. This includes scrap material as well as material that must be reworked, since OEE measures quality from a first-pass yield perspective.
Examples of common process defects include lot-to-lot raw material variation, incorrect equipment settings, or operator or equipment handling errors. In addition to process defects impacting OEE, the increased inspection needed as a result of poor quality results in added costs as well as potentially inferior or out-of-spec product reaching the customer. Best practice is to eliminate the defects altogether, as this will help the cost situation while providing a better product for the end customer.
Reduced yield accounts for material loss due to poor processing results and suboptimal finished product output. Examples of reduced yield include suboptimal changeovers, incorrect settings on a new product run, equipment that requires warmup cycles, or poor operator training. Yield losses can have a significant impact on a company’s profitability, depending on the associated costs, especially when taking into consideration the raw material price increases of the last few years.
Using a first time right mindset by increasing the first-pass yield saves time and hence costs. For example, think in terms of the goal of zero yield loss: It would be ideal if each one pound (or one unit) going into your process results in one pound (one unit) out of your process. This would represent 100% yield (fairly unrealistic).
Let’s say you determine your yield is at 90%. What are the drivers of that 10% in yield losses? You might investigate and discover a root cause that represents 2% (e.g., a poor metering system), another that’s 1% (e.g., container damage that occurs during material handling), another few that are 0.5% (e.g., air loss during mixing or stagnant inventory). All of these small issues can add up to a very, very big number in terms of losses.
When you understand where the 10% comes from, you can take steps to make improvements. Look first at the issues that have the biggest impact. Once those have been addressed, target issues with obvious (ideally, simpler) solutions.
Tracking Metrics on the Shop Floor
It can be difficult to achieve optimal performance if you are operating blind. One of the visuals recommended across plant shop floors is the TAED dashboard, which highlights the process target, actual, efficiency, and downtime:
- Target – Real-time production target driven by planned production rate
- Actual – Actual production rate
- Efficiency – Ratio of target to actual; how far ahead/behind production is running by percentage
- Downtime – Accumulated unplanned stop time updated in real time; this encourages a focus on a key actionable improvement area
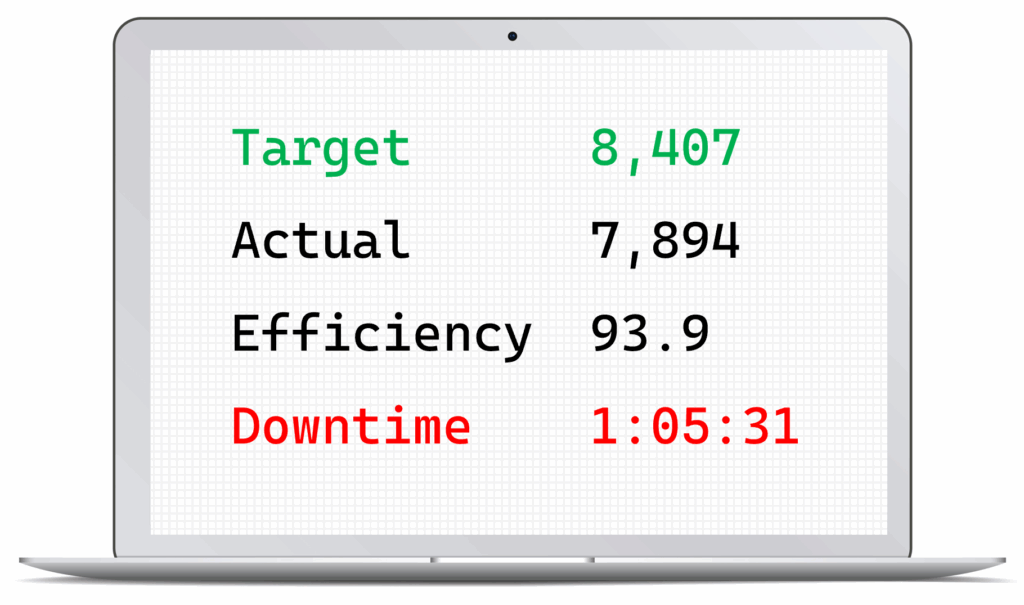
This simple dashboard for supervisors and shop floor personnel shows clear and achievable metrics that everyone on the team understands, and it helps the frontline production teams be focused on their activities in real time. The TAED can provide the teams with a sense of urgency regarding what has to happen to get back on track.
Additional Benefits of OEE
While OEE typically only measures the productivity aspects of production assets (both equipment and manpower), it can also have a positive impact on capital expenditures (CapEx) when processes are running optimally. For example, operating more efficiently allows companies to delay further investment in CapEx, which frees up cash. The resulting monetary resources might be better served in more profitable areas of a business — or even by not being spent at all, which only bolsters your company’s balance sheet.
To learn more, reach out to the author at rkramer@chemquest.com.
How can we help you? Let’s start talking: https://chemquest.com/lets-start-talking/
