
Table of Contents
It is not likely that the U.S. paint and coatings industry in 2023-2024 will be recalled, in decades hence, with any particular fondness—but neither will it be recalled with horror, unlike The Great Recession of 2007-2009, from which it took the industry more than a half-decade to recover. Despite sound underlying fundamentals in the U.S. economy, they are failing to exhibit their full potential for salubrious effect on the paint and coatings industry due to ongoing fears that interest rates will once again rise, and regulatory anxiety, especially related to the unfolding PFAS threat, is taking its toll. Nor is the U.S. immune to the chaos in the world around us—whether the war in Ukraine, the conflict in Gaza, the Houthi attacks on transport vessels in the Red Sea, or economic doldrums in the EU and China—everything going on around us affects the confidence of U.S. consumers.
Coatings volume from 2022 to 2023 was down 1.8%, while value was up slightly by 1.4%; volume and value from 2023-2024 estimated (2024e) are expected to be +2.6% and +5.3%, respectively. Looking ahead to the 2025 forecast (2025f), we should expect to see +2.3% growth in volume and no more than +5.3% in value. Not exactly fireworks and roses this year and next, but no cause for hanging one’s head in shame, either, given that we still have some remnants from the global supply chain crisis with us, especially with regard to certain pigments and additives and some degree of ongoing difficulty obtaining raw materials from Europe. The price of crude oil, while below its historical highs, is nevertheless sufficiently high that no one in the specialty raw materials industry is serving champagne or setting off Roman candles.
Over the past three years, galloping inflation was met by the Federal Reserve with galloping rate hikes, which finally began to ease in 2023. On June 12, 2024, the U.S. Federal Reserve decided to keep interest rates unchanged and indicated that only one rate cut is likely before the end of the year. The federal funds rate remains within the range of 5.25-5.50%. What the traders looked at was the dot-plot to figure out if—and when—a cut would occur. Nonetheless, while Fed chair Jerome Powell is anticipating only a single rate drop during the remainder of 2024, various members of the Federal Open Market Committee (FOMC) have signaled several different views on this front.[1] Four members anticipate no cuts, seven foresee one quarter-point cut, and eight support two cuts. The median projection for the benchmark federal funds rate is 5.1% by the end of 2024, implying just over one quarter-point cut. Through 2025, the FOMC now expects five total cuts, down from six in March, which would leave the federal funds rate at 4.1% by the end of next year.
While not all aspects of the Supply Chain Crisis of 2022-2023 have been completely sorted out, at least as of mid-2024, the majority of raw material suppliers and coatings producers are able to produce sufficient material to fill their orders with lead times, in the majority of cases, roughly the same as five years ago (i.e., prior to COVID-19). They aren’t necessarily conducting their businesses in the same way, however, because many firms have learned important lessons from the past four years and have changed multiple aspects of their approach to business in all areas—sales, technology, production, marketing, supply chain, etc. These changes have been more difficult for some than for others, but they have been necessary changes and have helped the producers that have implemented them.
The hard truth, however, is that such change is going to be necessary going forward for all paint and coatings producers, because the supply chains throughout the global economy are increasingly vulnerable and subject to disruption more readily than at any time prior to 2020. The Russo-Ukrainian War (including the potential for NATO to intervene at some point), a slowdown in the Chinese economy,[2] political tensions between the West and Russia/China, issues involving Türkiye’s relationships with both the EU and NATO, and the actions with respect to the widely misunderstood topic of “PFAS” that will be taken by various countries all have the potential to disrupt the supply chains to one degree or another. Moreover, any number of other factors in a globe fraught with distrust, contention, constant concerns about the price and availability of oil and natural gas, and an increasingly vocal consumer involvement with everything from global climate change and “sustainability” to microplastics in the environment will also have a destabilizing effect on global industry and its supply chains.
The Relationship of Crude Oil to the U.S. Paint and Coatings Industry, 2022-2025f
As a rule of thumb, every $10 increase in Brent crude results in a 3% increase in overall costs to coatings producers, which is significant with regard to the overall dynamics and profitability of the paint and coatings industry. It is, therefore, important to understand that an important component of a meaningful strategy is a clear understanding of “where things are” with regard to the near- and longer-term future of crude oil, as well as “where is this leading to?” in terms of both the near- and longer-term future of the U.S. paint and coatings industry.
This year, U.S. refinery capacity is running at 93-94% of capacity, which is higher than the long-term average of 89-90% and also higher than 2023’s 91-92%.[3] This is largely due to the $2 billion expansion of ExxonMobil’s Beaumont, Texas, facility that added a 250,000 barrel-per-day crude distillation unit (CDU), which made it the second-largest refinery in the U.S., second to Motiva’s Port Arthur, Texas, facility. Additional expansions were also completed by Marathon and Valero. The total number of refineries in the U.S. currently stands at 132, up from 129 one year ago, due to the positive net effect of a variety of closings and re-openings. In the longer term, the percentage of energy from fossil fuel products will be in very gradual decline between now and 2050, as renewables increase their share at a slightly greater rate of 4-5% per year. Energy from nuclear, biomass, hydrothermal, geothermal, tidal and wave, and “solar thermal” (which is not to be confused with “solar”) will maintain a small but steady presence for the coming 16 years or so, beginning to decline in roughly 2040, as shown in Figure 1.
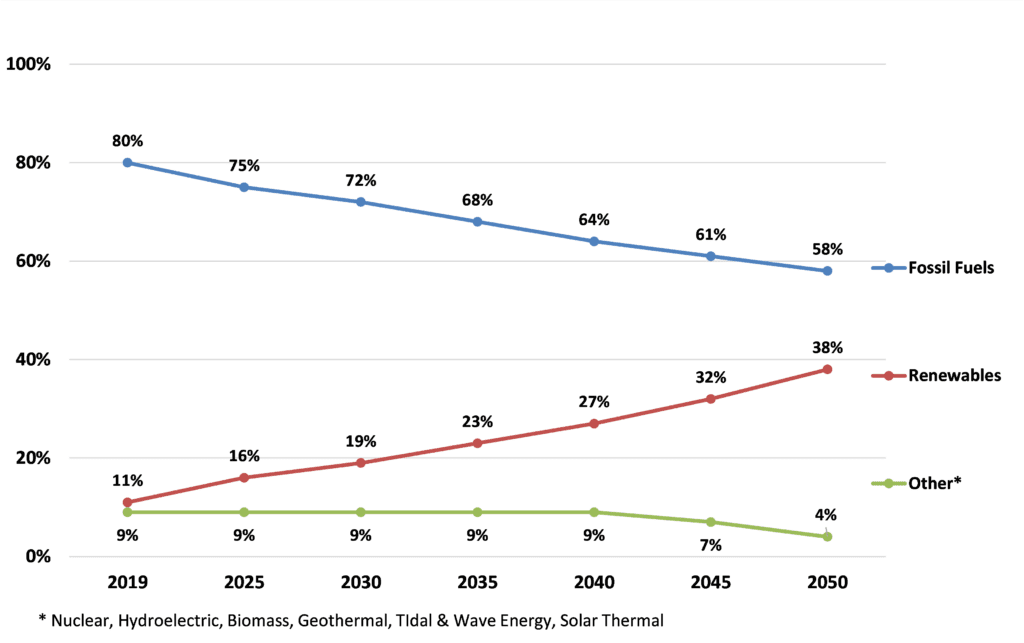
(Sources: bp Energy Outlook 2023 Edition; The ChemQuest Group, Inc.)
Because the use of chemicals derived from crude oil is in decline, and the use of bio-based chemicals is ascendant, there do not appear to be plans to significantly increase net crude capacity anytime soon, although there will continue to be a mixture of occasional new builds, closings, and re-openings.
A decline in crude oil refining is, of course, excellent news for both the long-term national and global good. In the short term, however, things are a bit more complicated, insofar as the U.S. chemical industry represents a $500 billion enterprise that accounts for 2% of total U.S. gross domestic product (GDP) while supporting the production of 25% of total U.S. GDP—in the form of the clear majority of all household and commercial goods—and serving as a major driver of economic growth.[4] Everything from fertilizers and paints and coatings to cosmetics and pharmaceuticals has its origins in crude oil. Derived from crude oil are many basic raw materials for all types of paints and coatings, regardless of whether they are 100% solids, powder, waterborne or solventborne, or energy-curing systems. While one might reasonably expect to see some easing of both supplies and prices of paint and coatings raw materials based on fossil fuels, any gains are very likely to be masked by higher energy costs, increased logistics costs, difficulty of obtaining—and higher cost of—labor, and higher prices of raw materials that are not derived from fossil fuels (e.g., mined pigments, bio-sourced offsets for oil-derived solvents, resins, and additives).
As of mid-2024, the U.S. paint and coatings industry is doing reasonably well, and very similar to 2023. Structural global issues will continue to mitigate against any scenarios in which “things return to [former] normal,” but the value of the U.S. paint and coatings industry in mid-2024e is +5.3% compared with mid-2023, and volume is up 2.6%, which is not at all bad, given the trials and tribulations of the past three years. In light of the foregoing considerations, what should we expect in full year 2024e and 2025f?
The State of the U.S. Paint and Coatings Industry, 2024e-2025f
In turbulent times (e.g., the COVID-19 pandemic, supply chain issues, runaway inflation, escalating interest rates), quarterly GDP data can be confusing. When COVID-19 became a household word in Q1 2020, GDP dropped about 5% vs. the previous quarter and then plummeted in Q2 by 33%. Unsurprisingly, it rocketed up to 34% in Q3 as employees in many industries got back to work, but this was hardly an indication that the U.S. economy was out of the woods.
The year 2021 returned to something more “normal-looking”—GPD was 5.9%. But that did not last, as inflation took over and the Federal Reserve needed to increase interest rates. GDP in 2022 was 1.9% and ended up at 2.5% for full-year 2023. GDP in Q1 2024e was 1.4%, and the Federal Reserve Bank of Atlanta (GDPNow™) is forecasting 2.0% in H1 2024.[5]
Real GDP increased in 39 states and the District of Columbia in the first quarter of 2024, with the percent change ranging from 5.0% at an annual rate in Idaho to -4.2% in South Dakota. The U.S. goods and services trade deficit increased in May 2024, according to the U.S. Bureau of Economic Analysis (BEA) and the U.S. Census Bureau. The deficit increased from $74.5 billion in April (revised) to $75.1 billion in May, as exports decreased more than imports. The U.S. net international investment position, the difference between U.S. residents’ foreign financial assets and liabilities, was -$21.28 trillion at the end of the first quarter of 2024, according to statistics released by the BEA. Assets totaled $35.78 trillion, and liabilities were $57.06 trillion. At the end of the fourth quarter of 2023, the net investment position was -$19.85 trillion (revised).[6] Personal income increased $114.1 billion (0.5% at a monthly rate) in May. Disposable personal income (DPI)—personal income less personal current taxes—increased $94.0 billion (0.5%). Personal outlays—the sum of personal consumption expenditures (PCE), personal interest payments, and personal current transfer payments—increased $56.4 billion (0.3%), and consumer spending increased $47.8 billion (0.2%). Personal saving was $806.1 billion, and the personal saving rate—personal saving as a percentage of disposable personal income—was 3.9% in May.[7]
The year 2024 is expected to be a mixed year for the paint and coatings industry in the United States. The year 2023 ended with production of 1.33 billion gallons valued at $32.8 billion, down from 2022 by 1.8% in volume but up 1.4% in value. The outlook for 2024e suggests a slight increase in full-year production, totaling 1.36 billion gallons, and an increase in value to $34.5 billion, as shown in Figures 2-4.
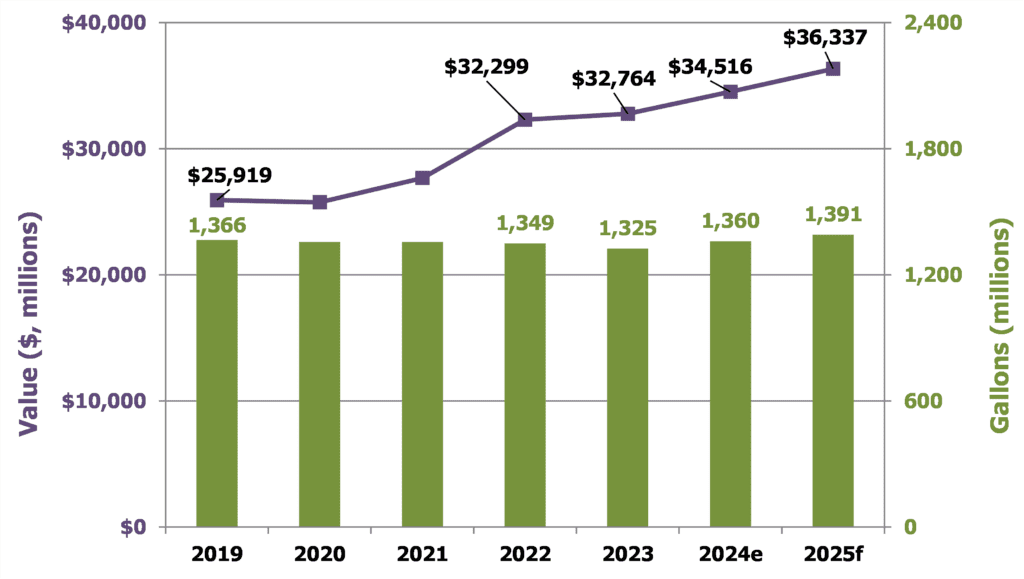
(Sources: The ChemQuest Group, Inc., estimates; Coatings TraQr®)
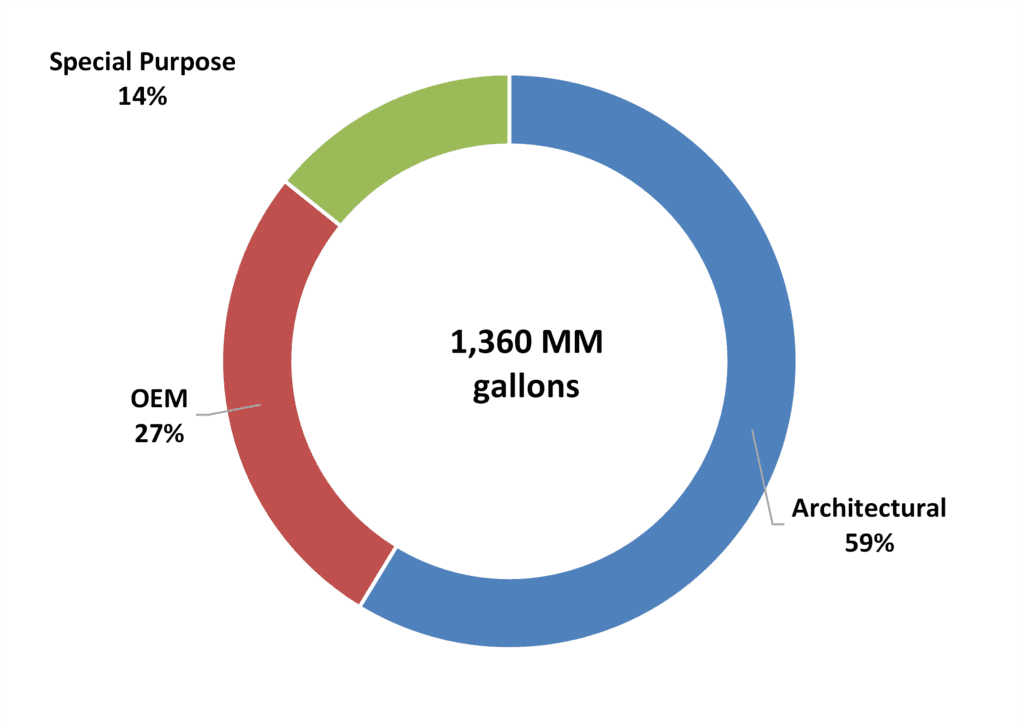
(Sources: The ChemQuest Group, Inc.; Coatings TraQr®)
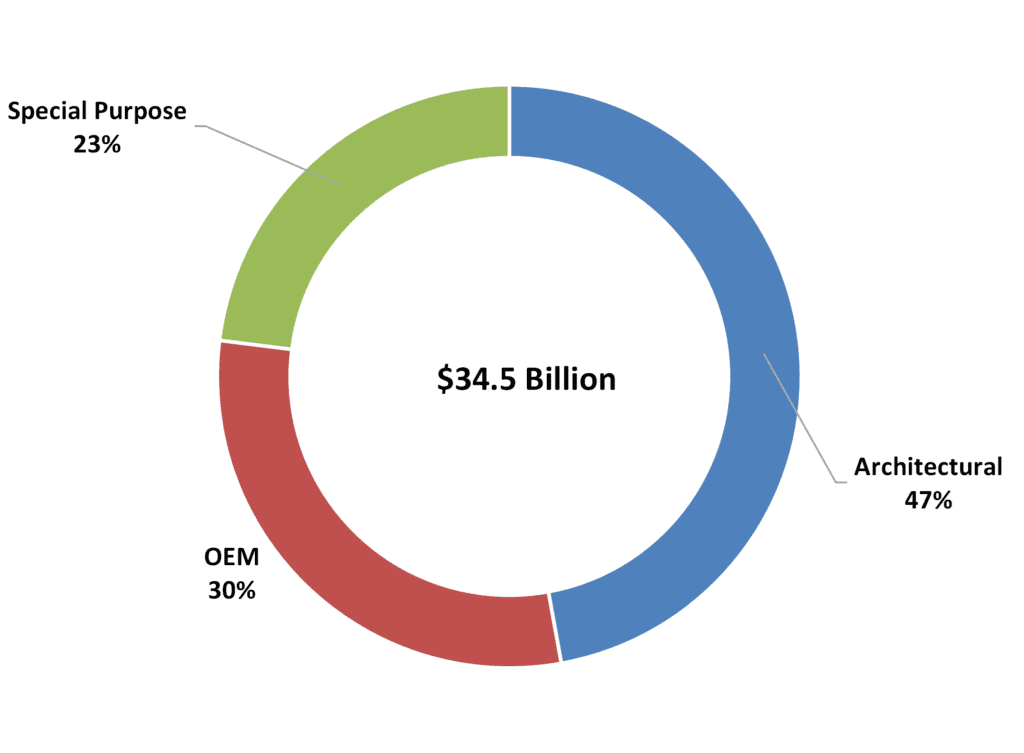
(Sources: The ChemQuest Group, Inc.; Coatings TraQr®)
Aggressive consolidation over the past two decades has enabled the top 10 global coatings firms to collectively account for 42.7% of global sales in 2023, up 1.0% from 2022, and the top four global players accounted for 73% of the top 10 global coatings firms’ sales in 2023, with no change from 2022 (Figure 5).
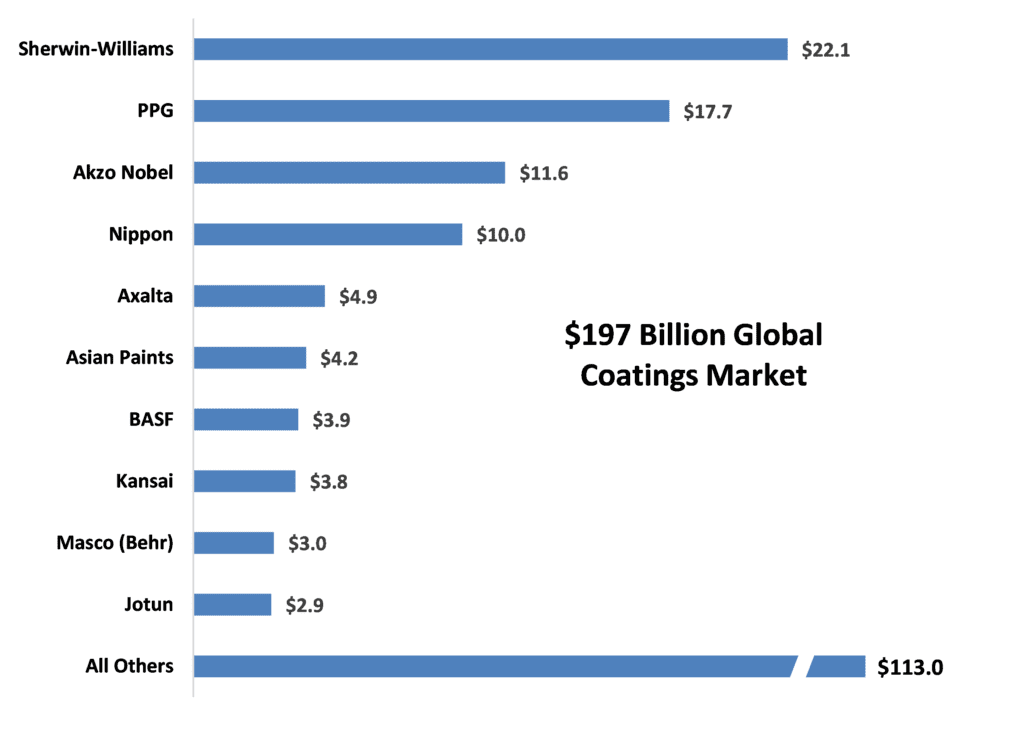
(Source: The ChemQuest Group, Inc., estimates)
Architectural Paints
Architectural coatings sales are highly correlated with the health of the housing/construction market. Within the U.S. coatings industry, the architectural paints segment accounted for 59% in 2024e (down from 60% in 2023) of the volume and 47% (down from 49% in 2023) of the value, as shown in Figures 3 and 4.
Due to the severe supply chain issues in 2022 and the accompanying raw material price increases, architectural coatings declined 4.4% in value in 2023 compared to its value in 2022, and the volume declined by 4.6%. The good news is that we expect an increase of 2.8% in volume during 2024e, and we also estimate an increase of 4.9% in value. Looking forward to 2025f, we anticipate a volume increase of 2.3%, with a value increase of 4.8%, as shown in Figure 6.
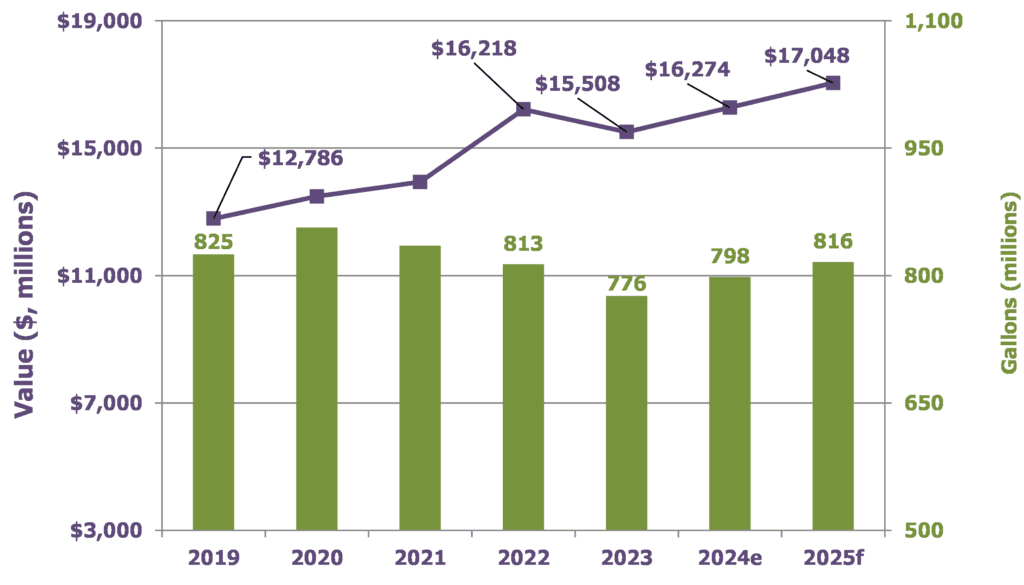
(Sources: The ChemQuest Group, Inc., estimates; Coatings TraQr®)
For decades, the ratio of the amount of professionally applied (PRO-applied) paint to the amount of DIY paint has been subject to the “rollercoaster effect.” Between 2010 and 2019, the percentage of PRO-applied paint increased steadily but then dropped significantly during 2020, as consumers who were homebound due to COVID decided to purchase paint and apply it themselves rather than hiring a PRO to do it for them. Following the flurry of homeowner painting activity in 2020, however, PRO steadily regained its footing from 2021 through 2023. During 2024e, we anticipate that the ratio will be back up to 63% PRO:37% DIY, aided by the commercial building sector that will help to offset the weaker residential sector (Figure 7).
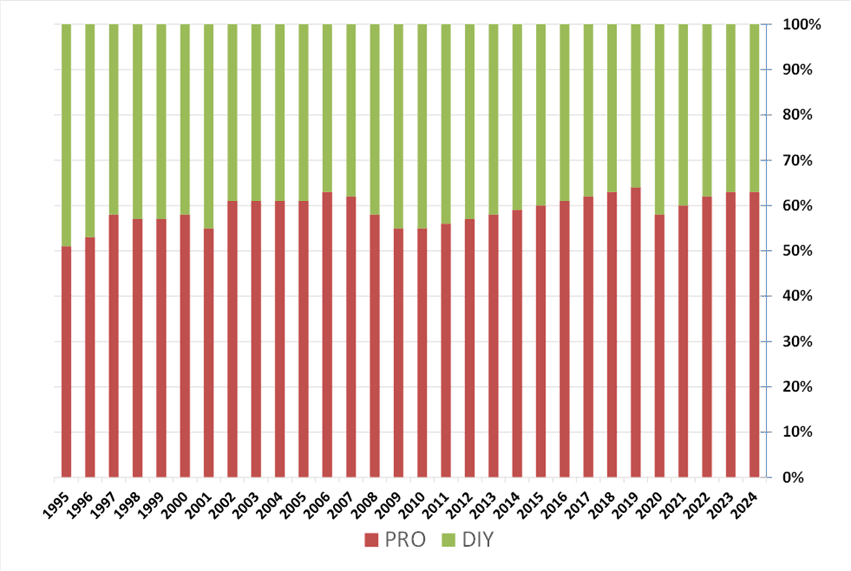
(Source: The ChemQuest Group, Inc.)
In 2023, U.S. construction continued its prolonged recovery from the unprecedented low point it experienced in 2011 and continued to be a major driver of the architectural coatings segment, which is closely correlated to construction. In 2024, we expect to see this trend continue. While it is true that there is a surplus of commercial office space in the U.S. that will slow construction down in that area, there is also a deficit of 1.8 million residential units to help offset the slowdown in commercial. Also, we have reason to believe that there will be a boost to construction associated with manufacturing, transportation infrastructure, and clean energy infrastructure, as funds from three key pieces of legislation passed in 2021 and 2022—the Infrastructure Investment and Jobs Act (IIJA), the Inflation Reduction Act (IRA), and the Creating Helpful Incentives to Produce Semiconductors (CHIPS) Act—are expected to flow into the industry.[8] As such, construction confidence remains high, with the Associated Builders and Contractors (ABC) identifying expectations for an increase in profit margins and staffing levels, particularly in the first half of 2024e.[9] Year-over-year growth in construction spending for 2023 was 10.0% and is anticipated to increase by an additional 6.1% during 2024e, for a total of $2.1 trillion. In some sectors, there are still lingering concerns about a potential recession, but the underlying fundamentals all appear to be sound, which would argue for either the absence of a recession or a very soft landing, if we were to sustain one (Figure 8).
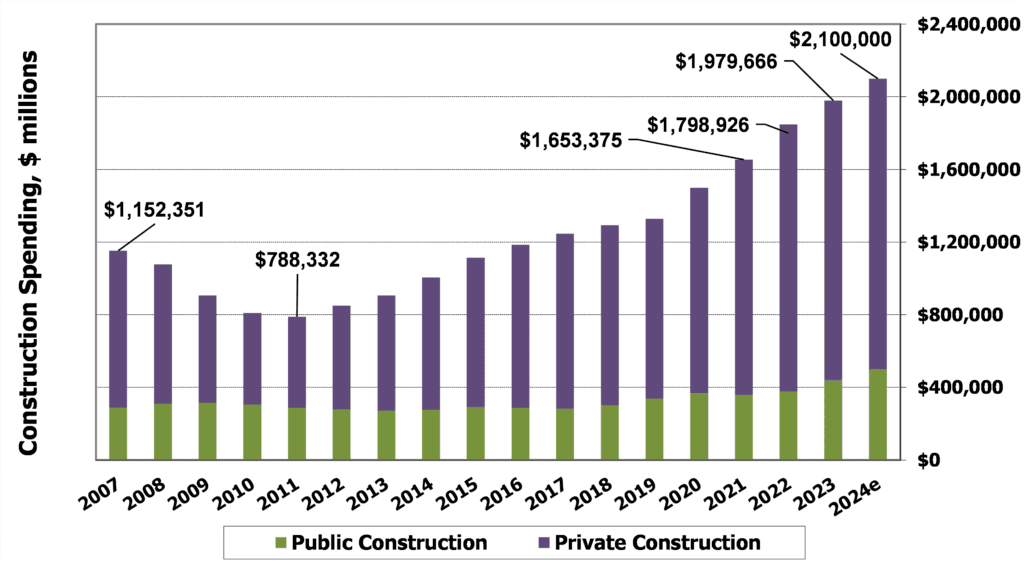
(Source: The ChemQuest Group, Inc.)
Historically, an additional driver for the architectural coatings segment has been remodeling, and activity in this area is monitored by the Joint Center for Housing Studies of Harvard University’s Leading Indicator of Remodeling Activity (LIRA). As shown in Figure 9, remodeling really gained steam in 2020 and maintained momentum through Q3 2023, followed in Q4 2023 by a slight drop-off in activity, which continued into Q1 2024e. LIRA is now anticipating a rally in Q2 2024e, followed by further negative growth at least through the first quarter of 2025f (Figure 9).
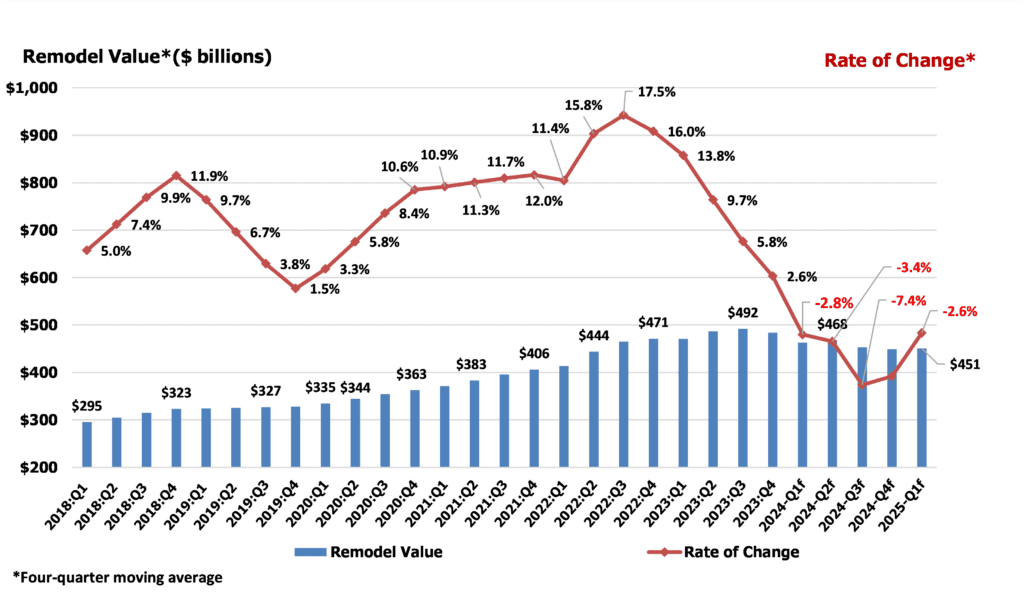
(Sources: Joint Center for Housing Studies of Harvard University; The ChemQuest Group, Inc.)
Industrial OEM
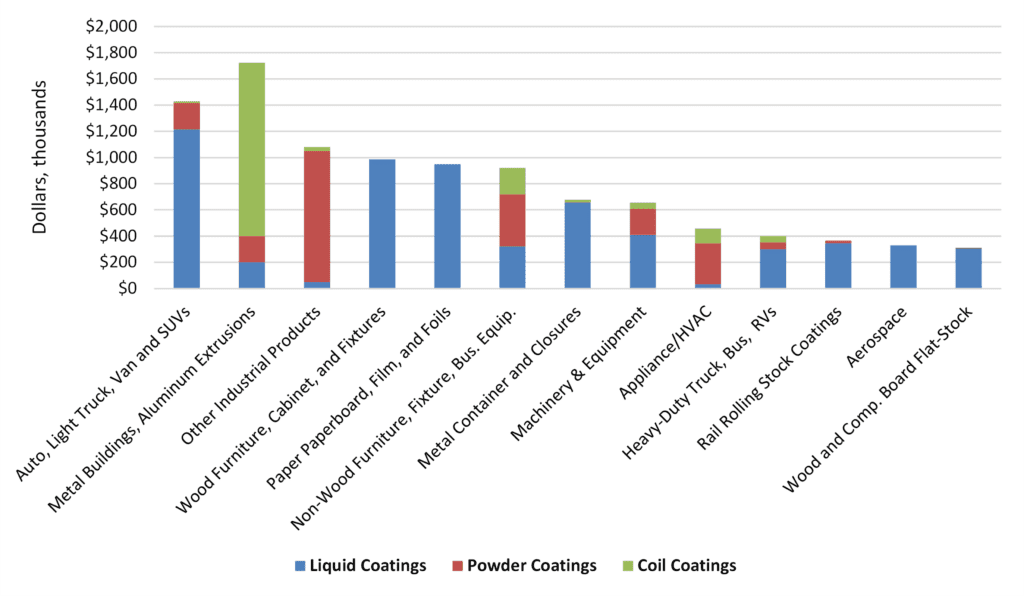
A dozen+ subsegments comprise the industrial OEM segment, including major appliances and agricultural equipment; fireplaces and HVAC; automotive OEM (including rigid and flexible automotive exterior trim systems and brake systems, et al.); extruded metal for curtain wall; coil coatings, wood furniture, and cabinets; and a number of additional representative coatings subsegments (Figure 10). As a result of such a diversity of goods, the industrial OEM segment is driven by a variety of factors, although most are influenced by the macroeconomic environment and especially by industrial production.
(Source: The ChemQuest Group, Inc., estimates)
The U.S. industrial OEM segment grew in value by 6.8% in 2023, generating $9.8 billion in sales while producing 360 million gallons. In 2024e, we expect to see an increase of 5.5% in value and 2.2% in volume, resulting in $10.3 billion in sales on 368 million gallons. Looking forward to 2025f, we anticipate value of $10.9 billion (+5.5% over 2024e) on 377 million gallons, an increase of 2.4% over 2024e, as shown in Figure 11.
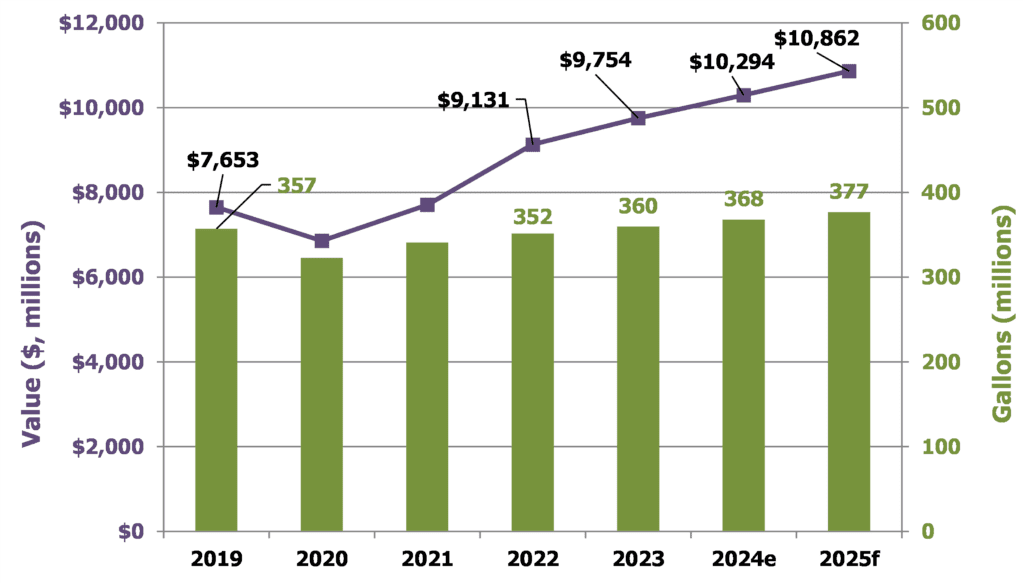
(Sources: The ChemQuest Group, Inc. estimates, Coatings TraQr®)
The automotive subsegment (defined as the total of domestic production, transplants, and imports of automobiles, light trucks, vans, and SUVs) enjoyed a year of significant improvement during 2023 and will continue to grow during 2024e.
As of May 1 of this year, total automotive builds are running at 11.2 million units per year SAAR (seasonally adjusted, annualized rate), driven primarily by light trucks. Automobile growth (which includes SUVs but not light trucks) has been essentially flat for 2022-2024e and is likely to remain that way (possibly even a slight decline) into 2025f, given the increasing popularity of light trucks (Figure 12).
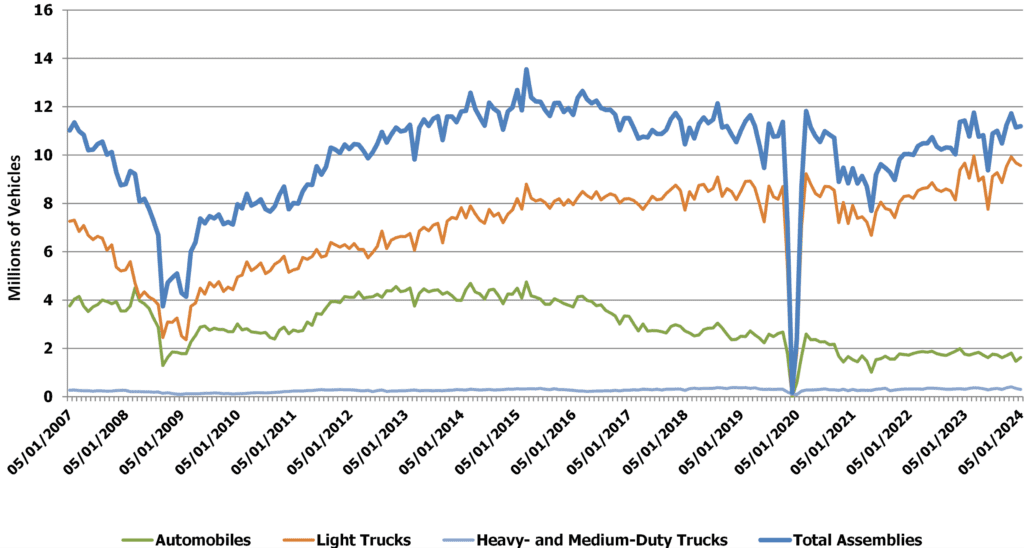
(Source: Federal Reserve Bank of St. Louis; The ChemQuest Group, Inc.)
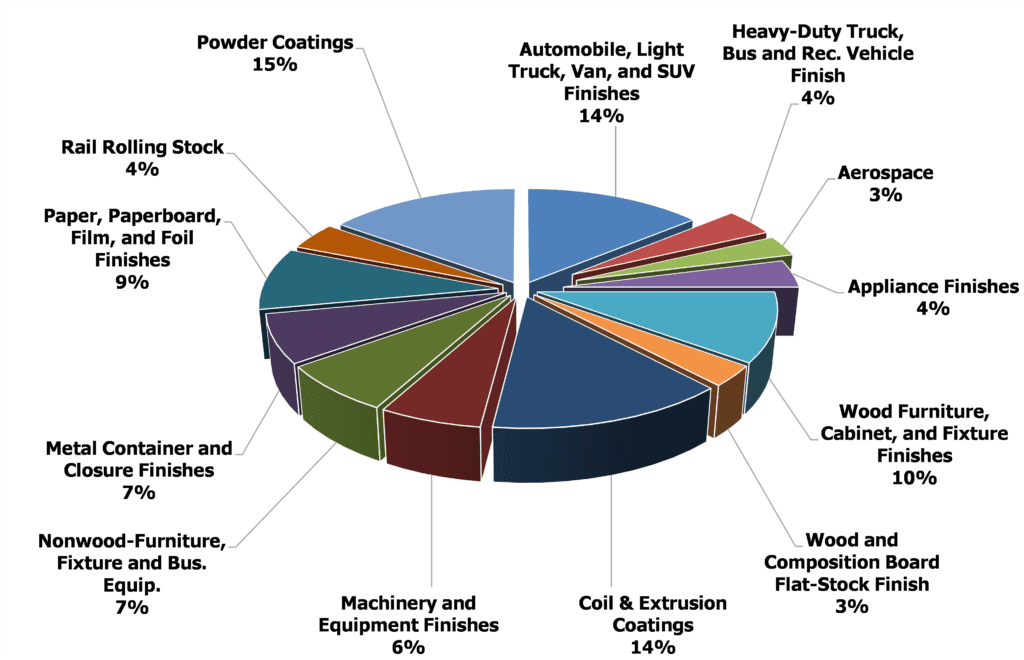
As was demonstrated in Figure 10, factory-applied coatings are divided over a number of markets, with two exceptions:
- Powder coatings used to coat a large number of parts for a broad array of market segments comprise 15% of the OEM coatings market in 2024e, which is down from 19% in 2023. While this is an important coatings technology, it is not a market. A number of market segments and subsegments have gravitated to some level of powder coatings over the years, including metal furniture, appliances, and automotive underbody, and powder is making a certain level of incursions into extruded metal and a number of other market areas. Powder coatings have largely replaced solventborne liquid coatings in “job shop” applications. Nonetheless, we believe that the growth of powder coatings has become asymptotic with its current opportunities and will continue to grow, but not by much more than overall market growth.
- Coil-applied coatings and spray coatings for extruded metal make up 14% of the OEM market, down from 15% in 2023. Coil coating is an application technique, not a market, although its major targeted market area is metal building products. Coil coatings also have found usage in appliance/HVAC; heavy-duty truck, bus, and RVs; as well as a few smaller areas. Spray-painted aluminum extrusions are most often used as a building product in conjunction with coil-coated metal, which is why this category is combined with coil coatings. It is helpful, however, to see the full array of market segments in which powder coatings and coil coatings are used, in the context of the major OEM industrial markets (Figure 13).
(Source: The ChemQuest Group, Inc., estimates)
Trends in the industrial OEM market segment are driven by the desire for:
- Sustainability—Reduction in carbon footprint of both the formulated coatings and the raw materials used in those coatings; increased use of bio-sourced materials; product end-of-life reuse/disposal solutions, and continual innovation to achieve these ends.
- Creating operational efficiencies (e.g., increased productivity, reduced labor, or decreased cycle times)—fewer coating layers, thinner coating layers, greater availability of wet-on-wet systems.
- Innovation—Self-healing and self-cleaning coatings, self-stratifying coatings, coatings with “pollution-eating” properties, coatings that respond to stimuli by altering their properties (“smart coatings”), burnish- and scratch-resistant matte coatings, coatings with solar heat management characteristics, coatings with print-friendly surfaces, etc.
- Robust functionality—ability to coat mixed-material substrates, composites, alloys, and other non-traditional surfaces that are being used for the purpose of lightweighting vehicles and equipment and to impart unique structural properties.
- Design and customization—increasing interest in made-to-order coatings to provide consumer engagement and for industrial coatings companies to differentiate on services.
- Reshoring certain products to reduce dependency upon imported materials.
Special Purpose Coatings
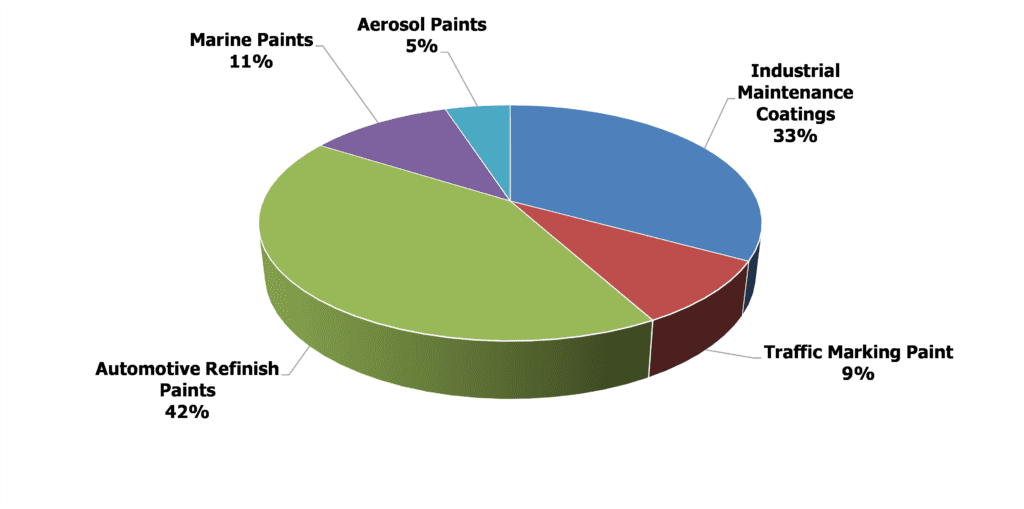
Automotive refinish paints, industrial maintenance/protective coatings, marine coatings, traffic-marking paints, and aerosol paints comprise the major end markets for special purpose coatings, as shown in Figure 14. The special purpose coatings market segment is comprised of far fewer end-market segments and subsegments than is the case with industrial OEM coatings, but special purpose coatings typically command higher value and overall margins than industrial OEM coatings.
(Source: The ChemQuest Group, Inc., estimates)
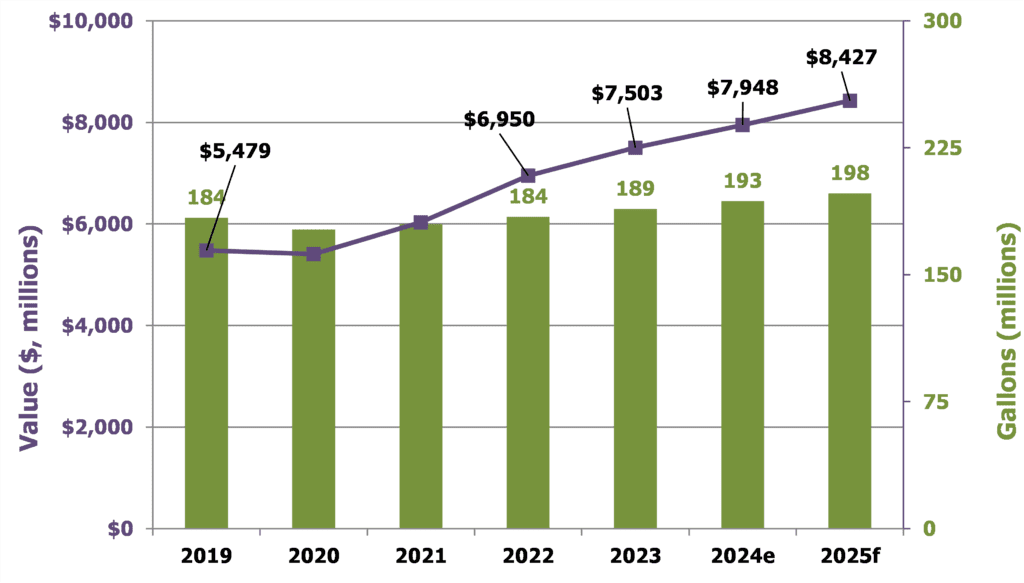
In 2023, special purpose coatings grew in value to $7.5 billion, which equates to 8.0% growth compared to 2022, and volume grew to 189 million gallons, representing 2.7% growth over 2022. In 2024e, we are expecting an increase in value of special purpose coatings from $7.5 billion to $7.9 billion, as volume increases from 189 million to 193 million gallons. This represents a forecasted sales (in dollars) increase of 5.9% and an increase of 2.1% in volume. In 2025f, we are forecasting $8.4 billion on 198 million gallons, for an increase in value of 6.0% and in volume of 2.6% (Figure 15).
(Sources: The ChemQuest Group, Inc.; Coatings TraQr®)
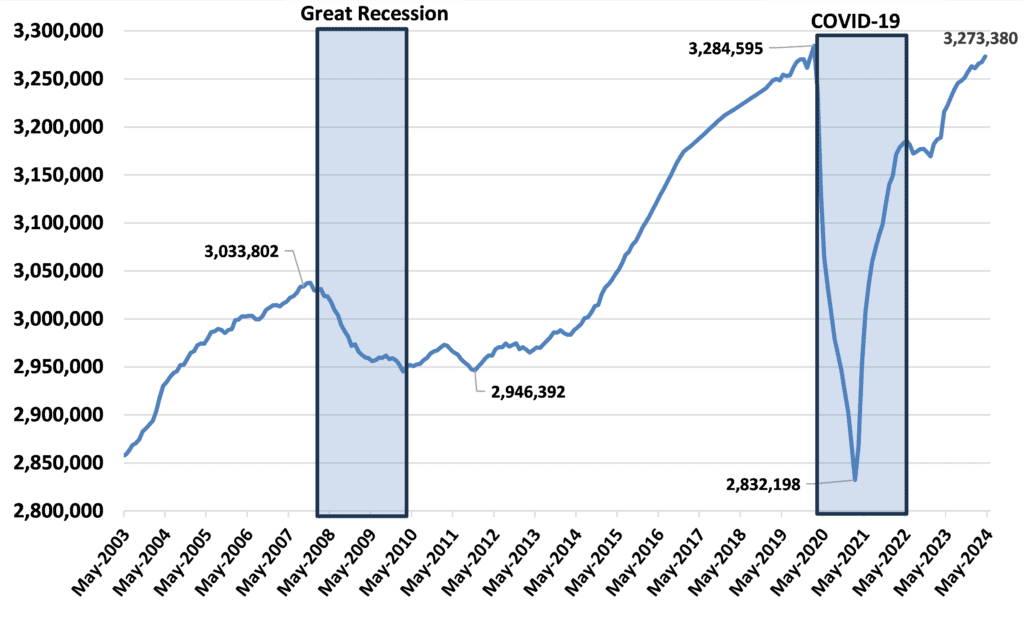
The two largest segments under special purpose coatings are automotive refinish coatings and industrial maintenance (IM)/protective coatings, respectively. Automotive refinish coatings tracks accident rates, total vehicle miles driven (Figure 16), automotive sales, and size of the car parc (the total number of registered vehicles in use at any given point in time).
(Sources: St. Louis Federal Reserve; The ChemQuest Group, Inc.)
Sales of automotive refinish coatings are typically growing slightly or declining slightly from year-to-year, and predictions for the future either foresee slight growth or slight decline as a result. Such equivocal forecasts are the natural outgrowth of a market sector that is an easy target of the “yoyo effect”—constantly teetering on the brink of growth vs. decline, depending upon a number of conflicting factors being in the ascendancy at any given time. Improved ongoing education of the populace with regard to safer driving habits and the advent of safer, “smarter” cars that help with accident reduction and damage mitigation with an assortment of collision-avoidance devices and systems (e.g., energy-absorbing bumpers, back-up cameras, adjacent vehicle indicators, and automatic controls that keep cars from accidentally crossing the center line) are both significant factors that tend to reduce automotive refinish coatings sales, because they help to reduce the number of accidents and also to reduce the amount of damage per accident.
The positive effects of these factors, however, are frequently mitigated (at least to some degree) by factors that favor increased usage of automotive refinish coatings—factors such as drivers talking, texting, and glancing at GPS screens while driving; increased disposable income; changing lifestyle and buying behavior; and demand for luxury vehicles, including crossovers and SUVs. Neither crossovers and SUVs nor their drivers are documented to be more accident-prone than other cars and their drivers, but luxury car owners tend to have scratches and minor dings repaired more readily than non-luxury vehicle owners, thereby increasing the usage of automotive refinish paint.
U.S. sales of automotive refinish coatings were $3.1 billion on 40.3 million gallons in 2023, up 6.9% in value and 2.5% in volume over 2022, and are projected to increase in 2024e to $3.3 billion (+6.5%) on 42.3 million gallons (+5.0%). For 2025f, we are projecting sales of $3.5 billion (+6.1%) on 43.4 million gallons (+2.6%). Over time, however, we anticipate that the various factors that affect the use of automotive refinish coatings will begin to favor fewer accidents and other “need to repaint” scenarios, and that this market will begin trending downward at an estimated rate of 0.1-0.5% per year in volume beginning in the period 2028-2031.
The IM/protective coatings track industrial construction and maintenance of medium- and heavy-duty facilities such as wastewater treatment plants and petrochemical facilities—especially oil and gas (O&G), which represents ~ 30% of protective coatings volume—drinking water towers and facilities, and infrastructure refurbishment. It also indirectly tracks global crude oil prices, which ranged from $55-65/barrel in 2019 for West Texas Intermediate (WTI) to $122/barrel in mid-2022, $68-80/barrel during H1 2023 and $72-86/barrel, January-May, 2024e.
The I/M and protective coatings market segment represented 60.5 million gallons valued at $2.5 billion in 2023, an increase from 2022 of 3.1% by volume and 0.7% by value. We are predicting an increase in volume of protective coatings of 2.6% and an increase in value of 6.1% in 2024e, representing 62.1 million gallons valued at $2.7 billion, driven largely by construction and infrastructure. Going into 2025f, we anticipate growth over 2024e of 6.2% to $2.8 billion in value and 2.3% growth in volume to 63.5 million gallons.
Industry Expectations for 2024e
The year 2023 was decent for the U.S. coatings industry, despite the reduced, but nonetheless very real, daily travails that were an unavoidable aspect of doing business for the entire year. Compared to 2022, sales were up 1.4% in value, despite a decrease in volume of 1.8%. Because pricing clearly outpaced volume, it is a reasonable assumption that, as an overall industry, coatings producers were able to keep ahead of raw material increases at an appropriate pace, although this almost certainly varied on a producer-by-producer basis.
We estimate that 2024e will see an increase in value of the U.S. paint and coatings market by 5.3%, with volume increasing by 2.6%. The total value of the U.S. market is expected to be $34.5 billion on 1.36 billion gallons in 2024e. The U.S. paint and coatings industry remains large and relatively healthy—but the outlook for 2025f suggests that growth will continue at a very slightly slower rate than 2024e. We currently foresee a 2.3% growth in volume and a 5.3% growth in value in 2025f, representing 1.39 billion gallons valued at $35.7 billion. While this is nothing to give rise to rejoicing in the streets, it isn’t bad, either. There have been times, in past decades in the paint and coatings industry, when we would have welcomed volume and value growth of 2.3% and 5.3%, respectively, with open arms.
Do We Have a “New Normal”?
Yes, a “New Normal” grew out of the trials and tribulations of the years 2020-2022 and is still evolving. Today, the entire globe is faced with challenges that are relatively similar from region to region, albeit of varying intensity. Producers who believed that raw material price increases were finally beginning to stabilize toward the end of 2023 woke up in early 2024 to discover that the cost of transoceanic shipping is once again on the rise, thanks to the Houthi activity in the Red Sea.
Supply chains were reasonably stable during 2023 but are showing signs of weakening during 2024, and the causes are pretty much the same as they were 3-4 years ago: research and development programs that have not yet regained full traction; market studies conducted by less experienced people who are having difficulties “reading the times”; availability of labor; wages and salaries that are still in a state of flux; and the migration of workers at all levels from “the office” to “the home”—or, even worse—the migration of highly experienced specialists to either other industries or into retirement.
The remote workforce is an issue that has many tentacles. As a reference point, 42% of companies allowed hybrid schedules in 2021 compared to 81% in 2024. This is why it is crucial to remember that many staff members expect to be allowed to keep some flexibility in their schedules when implementing RTO (return-to-office) mandates. Actually, 48% of American employees will look for a remote work position for their next job. By the end of 2024, it is likely that 80-90% of all companies with office space will have issued RTO policies, but 60-70% are equally likely to offer incentives such as catered lunches, childcare, commuter benefits, and other perceived benefits to entice the majority of workers to comply with RTO policies.[10] It is also important to understand that, in our New Normal, “back in the office” does not necessarily mean “back to the office every day,” but something more like, “back to the office 60% of the time, and at home the remaining 40% of the time.” While a lot has improved in 2024 over the previous three years, we are still faced with a number of moving targets that are making life complicated for everyone.
Strategic Planning is Mandatory for Dealing with Moving Targets
The winners and losers among paint and coatings producers and the raw material suppliers that support them will be determined by who has developed effective strategies for the future, and who has not. The coatings industry is still reeling from three very stressful years in which more than just raw material shortages, late deliveries, and skyrocketing prices were problems. The loss of key personnel, along with their collective experience, who either burned out and left the industry or who simply couldn’t stand the stress and retired much earlier than they had planned, will be felt by the paint and coatings industry for years to come, especially in the technology and marketing areas. Such experience is developed slowly and deliberately over significant periods of time and cannot be recreated or duplicated in the short term. Once it is gone, it is gone, and this should be the most sobering and thought-provoking takeaway from this article. . . . Full stop.
The global pandemic did not cause the global supply chain crisis—it simply exposed the supply chain weaknesses that were already built into the system. We have been living dangerously close to the edge for many years without acknowledging it. Global supply chains lack fundamental resilience, and, while they appeared to improve in 2023, we are already seeing signs of “the gremlins at work” in 2024e. It will only be Q4 2025 or later that we will be able to determine what permanent changes were made and to what degree they were efficacious.
Focusing on tactical solutions for the problems that everyone will experience under the New Normal will be a nearly universal temptation that will be difficult to ignore, because we must deliver the financial performance demanded by our investors. For the long-term good of our businesses, however, as well as the continued confidence of our investors, it is vital that we use our recent history to guide the creation of a strategy that will move us “back from the edge” so that future surprise events will not have such a debilitating effect on our individual companies and on the U.S. economy, in general. The only way forward for coatings and raw material suppliers to the coatings industry is to make sure that we have learned the value of having a carefully considered and clearly articulated business strategy. We cannot just talk about creating a strategy; we must create one for every business in the paint and coatings market supply chain.
Going Forward
Seasoned technical expertise in an industry that develops and sells technology is critically important—and what has been lost, while it cannot be either easily or soon replaced, must nonetheless be available in any producer that hopes to be viable 5-10 years from now. Whether raw material and paint and coatings producers create their strategies and new products “in-house” or work with outside partners, meaningful strategy must be considered honestly, openly, carefully, and, most of all, seriously.
Consequently, raw material suppliers and paint producers are looking to universities, independent third-party technology institutions such as ChemQuest, third-party testing laboratories, and independent subject matter experts to supply them with the experience that was once “in house” but has now disappeared and cannot be backfilled with other personnel who lack sufficient experience and expertise. At ChemQuest, we are actively helping manufacturers in the specialty chemicals value chain deal with the effects of this loss of experience, whether in paints and coatings; adhesives and sealants; lubricants; personal care; HI&I; and a variety of other areas. Although both a period of global crisis and long-term poor management by many producers caused the situations that precipitated this loss of valuable expertise, a timely opportunity has arisen to explore the experience and creativity of highly experienced, independent paint and coatings experts who bring a wealth of technical and marketing knowledge and operational know-how to bear upon the challenges and opportunities of the paint and coatings producers who seek their help to solve a universe of diverse issues in an efficient, cost-effective manner.
Bottom Line
Now is the time to “catch the wave” of the future, which will usher in an era in which cross-functional in-house resources, working with independent experts, will be the most efficient and cost-effective approach to meeting increasingly demanding time-to-market requirements with appropriate new paint and coatings products.
For more information, contact the author at at gpilcher@chemquest.com.
Read in CoatingsTech.
References
1. Ciccomascolo, G.; Projected US Interest Rates in Five Years: Will Fed Cut Rates In 2024?; https://www.ccn.com/analysis/projected-us-interest-rates-in-5-years/#:~:text=The%20median%20projection%20for%20the,the%20end%20of%20next%20year (accessed July 19, 2024).
2. Zhang, E.; Yao, K. China’s Economy Slows in May, More Stimulus Expected; Reuters, June 15, 2023. https://www.reuters.com/world/china/chinas-economy-slows-further-may-weak-demand-drags-2023-06-15/ (accessed July 19, 2024).
3. YCharts. US Utilization of Refinery Capacity (I:USURCNW); https://ycharts.com/indicators/us_operable_crude_oil_distillation_capacity (accessed July 6, 2024).
4. Cybersecurity & Infrastructure Security Agency. Chemical Sector Profile; x March 2022. https://www.cisa.gov/sites/default/files/2023-02/chemical_sector_profile_final_508_2022_0.pdf (accessed July 12, 2024).
5. Federal Reserve Bank of Atlanta. https://www.atlantafed.org/cqer/research/gdpnow (accessed July 5, 2024).
6. Bureau of Economic Analysis, https://www.bea.gov/data/intl-trade-investment/international-investment-position (accessed July 19, 2024).
7. Bureau of Economic Analysis, https://www.bea.gov/data/income-saving/personal-saving-rate (accessed July 19, 2024).
8. Bushey, H. The Economics of Public Investment Crowding in Private Investment; In https://www.whitehouse.gov/briefing-room/blog/2023/08/16/the-economics-of-public-investment-crowding-in-private-investment/ (accessed July 6, 2024).
9. Associated Builders & Contractors, “ABC’s Construction Backlog Indicator Steady in August, Contractors Remain Confident,” September 12, 2023. https://www.abc.org/News-Media/News-Releases/abcs-construction-backlog-indicator-steady-in-august-contractors-remain-confident (accessed July 19, 2024).
10. Deskbird. “Return to Office Statistics: The Latest Guide,” February 1, 2024. https://www.deskbird.com/blog/return-to-office-statistics (accessed July 1, 2024).
How can we help you? Let’s start talking: https://chemquest.com/lets-start-talking/