
Table of Contents
Business Cycle Analysis is a vital aspect of economic assessment and strategic planning, guiding decision making for businesses, investors, and policymakers. At ChemQuest, we recognize the tool’s importance and frequently employ it in support of our clients, as well as during our own internal business planning. However, we learned through Voice of Customer that many of our clients were not using Business Cycle Analysis in their forecasting and data analysis activities.
To mitigate this and provide truly impactful and dynamic solutions, our team chose to incorporate Business Cycle Analysis into the ChemQuest TraQr® family of resources. Whether you subscribe to TraQr® Dashboard or TraQr® Reports, Business Cycle Analysis assists you in tracking economic indicators that are relevant to your business, enabling you to stay ahead of the curve, drive your business forward, and achieve your strategic objectives.
Using ChemQuest’s TraQr® resources and Business Cycle Analysis, you are empowered to proactively assess the economy, identify trends, and capitalize on emerging opportunities. As a result, you achieve a competitive edge by gaining the ability to make informed strategic decisions ahead of your competitors.
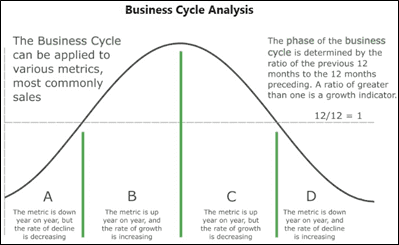
How does it work? It’s first important to understand the four phases used in Business Cycle Analysis to describe the business cycle:
- A = Advancing: The metric or indicator is down year on year, but that rate of decline is decreasing. The market is gearing up for growth.
- B = Best: The indicator is up compared to the prior year, and the rate of that growth is increasing. The market is in a growth cycle.
- C = Cautionary: The indicator is still up, but the rate of growth is decreasing. The market is slowing down.
- D = Depressionary: The indicator is down year on year, and the rate of that decline is increasing. The market is moving toward a trough or low point of the cycle.
Business Cycle Analysis in Action
ChemQuest’s TraQr® resources give you the ability to monitor the key economic indicators that are important to your business. The interactive TraQr® Dashboard provides you with the flexibility to explore and track these indicators, while our expert team has pre-selected indicators relevant to the market sectors detailed in TraQr® Reports.
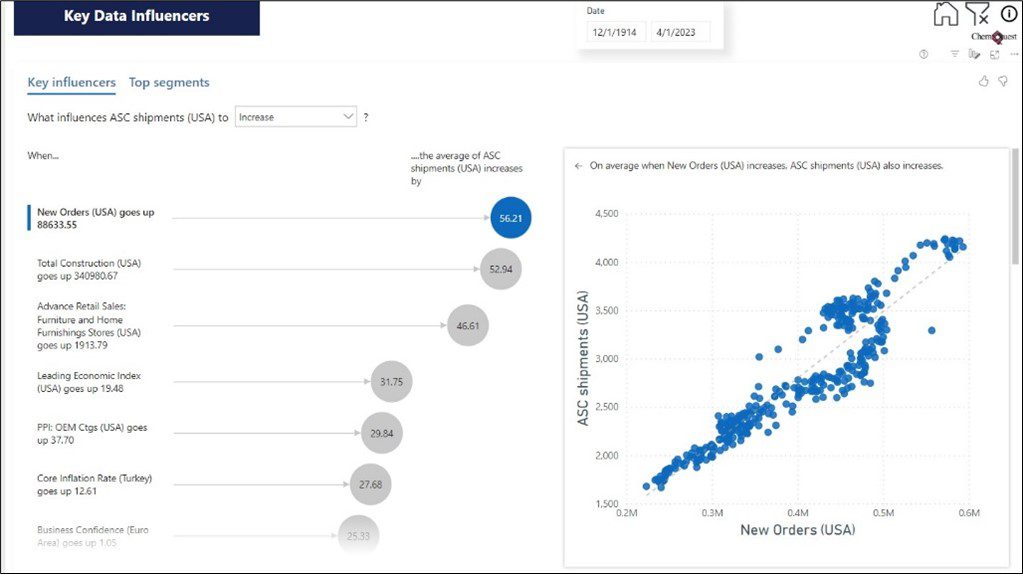
Let’s go through an example in TraQr® Dashboard to illustrate how Business Cycle Analysis comes into play to support data-driven decision making. Key Data Influencers within TraQr® provide insight into global economic conditions by following 2,000 datapoints that reflect statistical information from nearly every country. When looking at the Key Data Influencers in TraQr® Dashboard, you might notice that New Orders (USA) have a strong positive impact on shipments of adhesives, sealants, and coatings.
Recognizing the importance of that indicator to your business, you would then decide to delve deeper using Business Cycle Analysis. In Figure 3, we can see that the 12/12 and the 3/12 lines for New Orders (USA) crossed each other near the end of 2021, indicating a change in the Business Cycle.
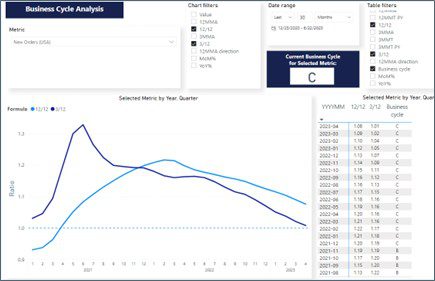
Indeed, as seen in the table on the right-hand side of the figure, the indicator went from a strong growth phase B to a slowdown in growth from October 2021 to November 2021, switching to phase C. In addition, the New Orders (USA) indicator remained stagnant in phase C for quite some time.
With TraQr® Dashboard and the Business Cycle Analysis tool at your disposal in November 2021, you would have had the foresight to make proactive and strategic decisions in response to the anticipated slowdown in New Orders (USA). This would have empowered you to adjust your business approach accordingly.
Consider the possibilities: You could have implemented measures such as reducing advertising expenditures or temporarily halting training programs to align with the prevailing market conditions. Furthermore, you might have opted to streamline inventory levels or heightened requirements to justify capital expenditures, ensuring a prudent allocation of resources.
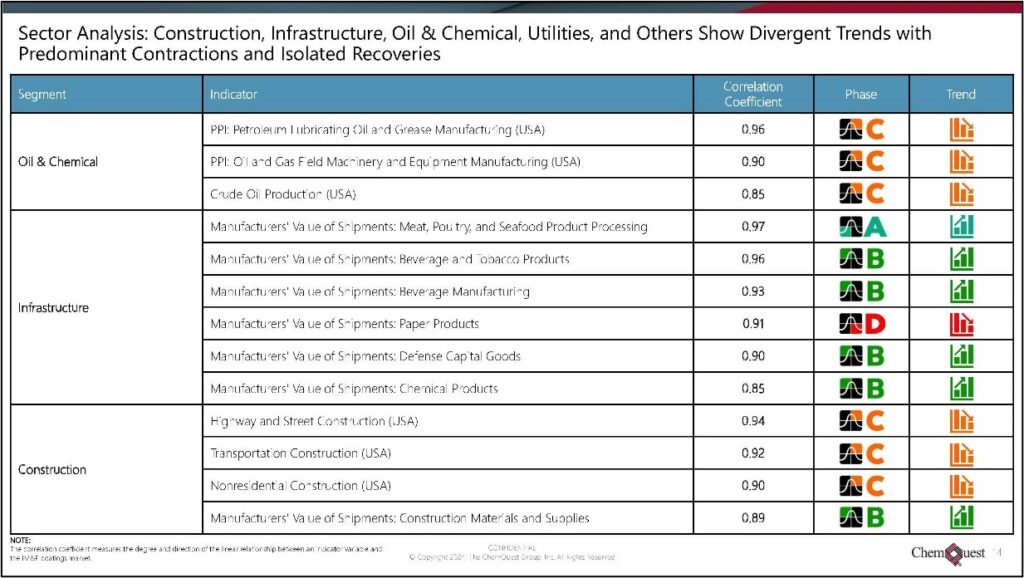
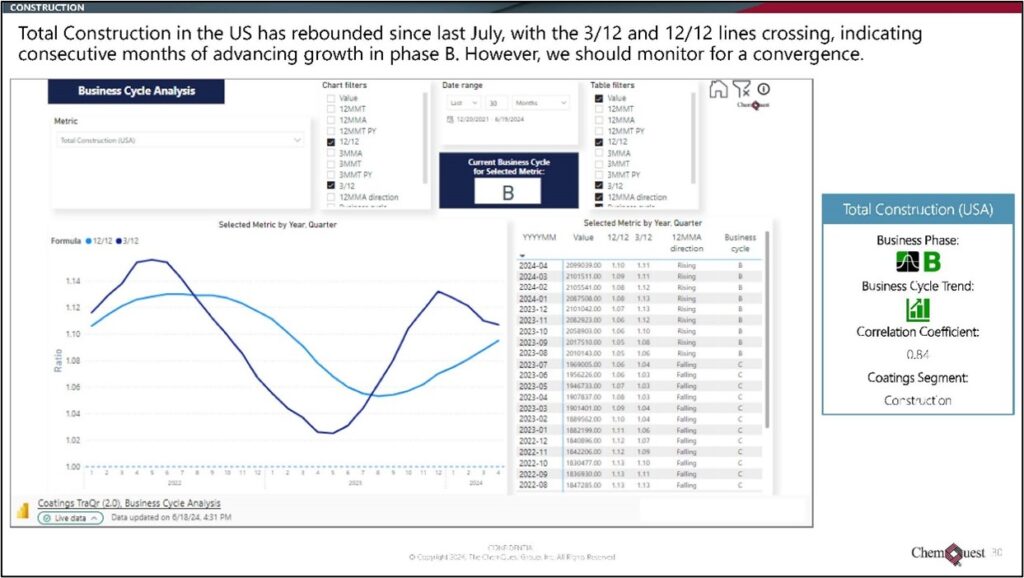
Though not interactive, Business Cycle Analysis also informs the forecasting and commentary our experts include with each edition of TraQr® Reports. Here, our team selects the key indicators that are relevant to the market segment, providing both an overview of the indicators’ business phases (Figure 4) and a detailed look at each individual indicator’s performance over time (Figure 5).
By leveraging the insights provided by ChemQuest’s TraQr® resources and the Business Cycle Analysis tool, you have the opportunity to position yourself ahead of the curve, optimizing your business strategies and mitigating potential risks. This data-driven approach to decision making enables you to navigate the ever-changing economic landscape with confidence and precision.
Understanding 12/12 and 3/12
The fundamental unit of Business Cycle Analysis is the 12/12 ratio, which is an indicator’s 12-month moving total compared to the preceding 12 months. Business Cycle Analysis ratios these numbers and plots them so we can understand what phase of the cycle the indicator is in.
If the 12/12 is less than one (1.0), the indicator is down year on year, but the rate of decline is slowing (i.e., it’s moving less). This represents phase A (Advancing). When seeing an indicator in phase A, you can make certain kinds of business decisions that are appropriate when gearing up for growth (e.g., taking on new staff, building inventory, and locking in supplier prices).
Once the 12/12 goes above one (1.0), the indicator is up year on year and has entered phase B (Best). In this phase, the most recent 12 months is greater than the 12 months prior, and the rate of growth is increasing. This knowledge enables you to make business decisions that are appropriate for a growth phase.
When that indicator’s 12/12 peaks, and growth starts slowing, it’s in phase C (Cautionary). You will want to be aware of this slowdown and potentially make business decisions that reflect this cautious stage.
Once the 12/12 is less than one (1.0), the indicator is down year on year, meaning it is in a phase of decline. If that rate of decline is increasing, it’s in phase D (Depressionary), so you may consider actions such as reducing and monitoring inventories closely, eliminating overtime, or cutting overhead hours.
How does Business Cycle Analysis establish these inflection points? How does it determine when the 12/12 stops increasing and begins decreasing or, conversely, when it stops decreasing and is now increasing?
Key to this determination is a ratio called 3/12, which is calculated by looking at the total of the most recent three months (instead of 12). Since it covers a shorter time span, the 3/12 is much more volatile than the 12/12 and serves as an earlier indication.
When an indicator is in either phase B or D, and the 3/12 and the 12/12 lines cross each other on the Business Cycle Analysis plot, the indicator has passed an inflection point. This indicates that it has moved from one business cycle phase to another.
Forecasting Success
Data noise can be confusing and lead to conflicting perceptions of the market’s reality. Depending on your company’s resources, you might not even have specific staff members responsible for performing market research. Whatever the reason, you may be operating with an incomplete picture of industry dynamics.
Leveraging sophisticated market intelligence tools like Business Cycle Analysis embedded within the ChemQuest TraQr® family of resources enhances the efficacy of your data-driven decision-making process, facilitating the attainment of your strategic objectives. By harnessing the power of visualizing market trends through Business Cycle Analysis and forecasting crucial industry indicators, you gain a pivotal piece of the puzzle that sets you apart from your competitors.
This formidable advantage empowers your company to stay ahead of the curve, positioning it for sustainable success in the long run. The ability to unlock invaluable insights and anticipate market shifts equips you with the foresight necessary to make informed and impactful business decisions. By capitalizing on this depth of understanding, you can navigate the intricacies of the market landscape with confidence, maximizing opportunities and achieving your organizational goals.
How can you put ChemQuest’s TraQr® resources and Business Cycle Analysis to work for you? We’d love to show you!
Reach out to info@chemquest.com today to schedule your personalized TraQr® Dashboard demo or request a free sample of TraQr® Reports.
