
Table of Contents
We all lived through the Great Supply Chain Crisis of 2022, and most of us lived to tell about it. While we would all like to think “that can never happen again,” the fact is that it is exceedingly likely that it not only can happen again, but that it will happen again. As we sit here three years later, the real question should not be “Will such a supply chain disaster ever occur again in the future?” but rather, “When will the next supply chain crisis hit the global manufacturing network?”
Following the Great Supply Chain Crisis, a lot of action was taken to prevent such an event in the future—action by businesses, both small and large; local and state governments; governments of countries around the globe; cooperative organizations such as the World Bank; and global non-profit organizations such as the Red Cross. A lot was learned, and a lot of the learning that was applied to the various areas of business, government, and global cooperative organizations was of a very positive and proactive nature and would certainly help to stabilize the global supply chain in the event of another unexpected event, such as COVID or a similar event destined to affect the entire global community and wreak havoc with the complicated arteries of commerce that carry the lifeblood of the global economy in them. What if, however, the next situation that negatively affects the global supply chain is neither sudden nor expected? What if, instead, it is a predictable set of circumstances that we know will cause such a problem, but which we cannot predict with regard to when it will have an impact? For the answer to this question, we simply need to look at the world around us in 2025. Whether ongoing tariff issues, the war in Ukraine, threats by Iran to close the Strait of Hormuz, cybersecurity controls, or the decision by Saudi Arabia to lower crude prices in search of market share, all companies are affected in some way, and to some degree, by those issues that affect global trade and which have already created a variety of negative situations for global industry participants. This is news everywhere, and on the lips of all.
On the largest scale possible—global trade—we are seeing the early stages of what are likely to become major shifts in the years ahead, with regard to “who trades with whom” and how this will affect global regional trading patterns. For example, it is highly likely that there will be decreased trade between both North America and the European Union (EU) with China, but increasing trade between North America and the Association of Southeast Asian Nations (ASEAN)—and both the EU and North America will be increasing trade with India and selected other countries in the “Global South,” such as Mexico, Brazil, Thailand, Vietnam, Nigeria, and Egypt (see Figure 1 and Table 1).[1]
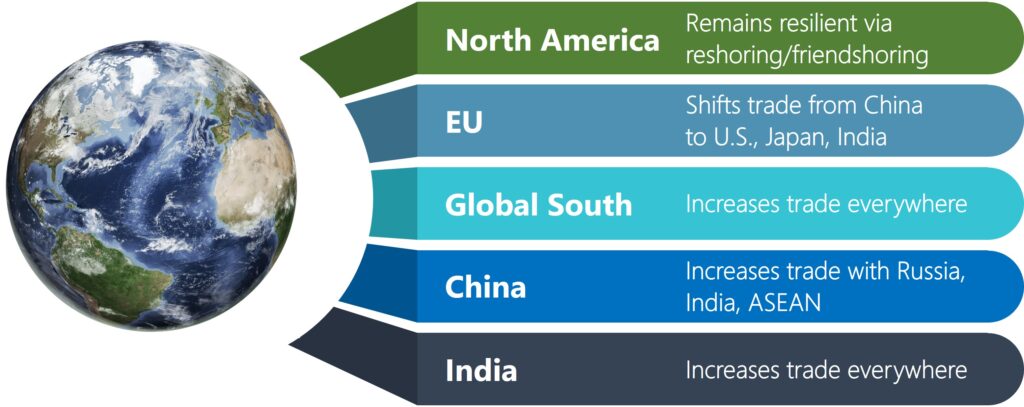
(Source: The ChemQuest Group, Inc.)
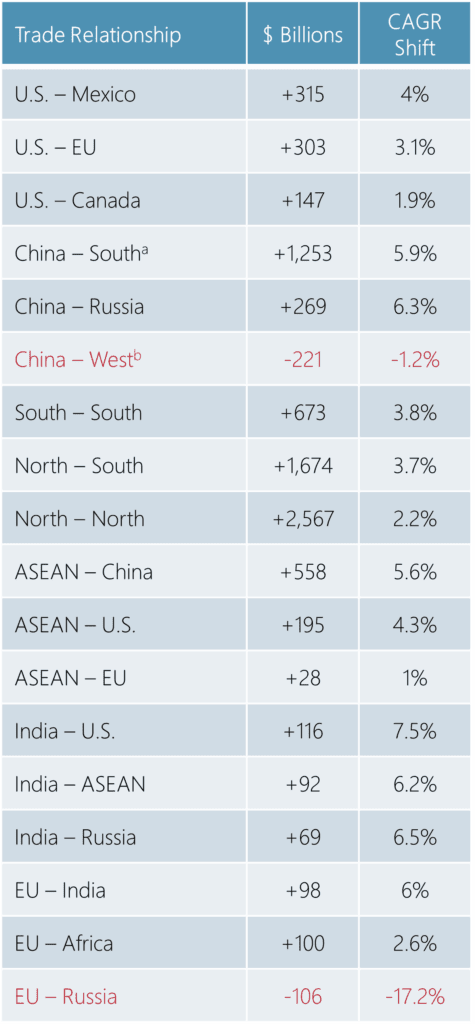
aSouth = 133 nations of the UN G77, excluding China
bWest = U.S., EU27, UK, Canada, South Korea, Japan, Australia, and New Zealand
The hard truth about the current worldwide economic scenario is that global supply chains are more fragile than ever, and everyone in the paint and coatings industry must be diligent about applying the lessons that they learned from the Great Supply Chain Crisis of 2022 to everything that they are doing today, while also preparing to react as quickly as possible to news from around the world that might affect both the supply chain and their individual businesses. At the end of the day, we are all going to need to consider some version of reshoring (and/or nearshoring, friendshoring, ally-shoring) to secure critical raw materials and control the cost of shipping. We are already seeing various steps being taken to reduce dependence on Chinese specialty chemicals, and this must continue into the future, being careful not to “cut off our nose to spite our face.” A China that is a friendly trading partner will always be preferable to a China that is a potential adversary.
The Relationship of Crude Oil to the U.S. Paint and Coatings Industry, 2023-2025e
Understanding what is happening now and what is likely to happen in the near- and longer-term future of crude oil production is necessarily an important component of the creation of meaningful strategy for paint makers worldwide. We must always bear in mind that every $10 increase in crude results in a 3% increase in overall costs to coatings producers, representing an important factor in the overall dynamics and profitability of the paint and coatings industry.
This year, U.S. refinery capacity utilization is running at 93-95% of capacity, which is higher than the long-term average of 89-90%, with a slight seasonal dip at the beginning of each year.[2] Over the last four years, refining capacity has remained in the range of 17.9-18.2 million barrels per day[3] (see Figure 2). However, there is no doubt that, in the longer term, the percentage of energy from fossil fuel products will be in very gradual decline (roughly negative 1% per year) between now and 2050, as renewables such as solar, wind, hydropower, biomass, and geothermal, increase their share at a rate of 4-5% per year.
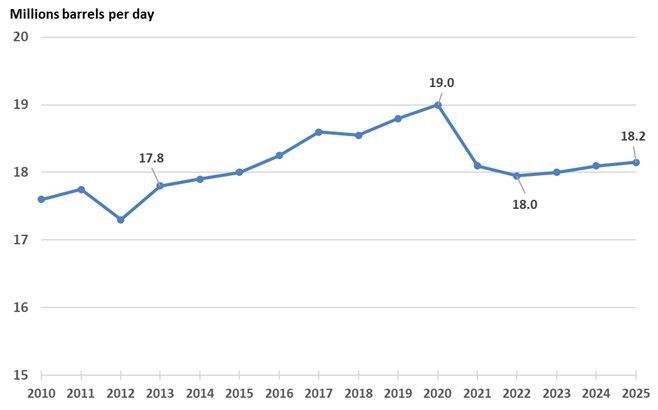
(Sources: The ChemQuest Group, Inc.; U.S. Energy Information Administration)
For the long-term national good, a decline in crude oil refining is, of course, excellent news. It is a bit more problematic in the short term, however. The U.S. chemical industry represents a $633 billion enterprise that constitutes more than 25% of total U.S. gross domestic product (GDP),[4] supports the production of almost all commercial and household goods, and is essential to economic growth. Everything from pharmaceuticals to cosmetics and fertilizers to paints and coatings, lies downstream from crude oil. Many basic raw materials for all types of coatings, whether waterborne or solventborne, 100% solids, powder, or energy-curing systems, are derived from crude oil. In the overall scheme of things, we should see some easing of both supplies and prices of paint and coatings raw materials based on fossil fuels, but this will not, of course, have any salutary effects on the cost and difficulty of obtaining labor, higher energy costs, logistics costs, or raw materials that are not derived from fossil fuels (e.g., mined pigments).
The State of the U.S. Paint and Coatings Industry, 2025e-2026f
The author and The ChemQuest Group, Inc. closely follow the global paint and coatings industry in order to produce articles such as this, as well as various industry presentations throughout the year. In addition, our ChemQuest TraQr® resource provides subscribers with access to regularly updated global market and economic information. Drawing upon the deep knowledge that is resident within ChemQuest’s databases, TraQr®, and experienced personnel, it is time to look at the “State of the U.S. Paint and Coatings Industry.”
The post-pandemic U.S. paint and coatings industry is doing reasonably well. There will continue to be structural global issues that will mitigate against any scenarios in which “things return to [former] normal,” but the value of the U.S. paint and coatings industry has grown. This seems both understandable and reasonable, given what the industry has been through during the past several years, and particularly in light of the anxiety and uncertainty caused by the tariffs and threats of tariffs in the U.S. With this in mind, what should we expect in 2025e (estimated) and 2026 forecast (2026f)?
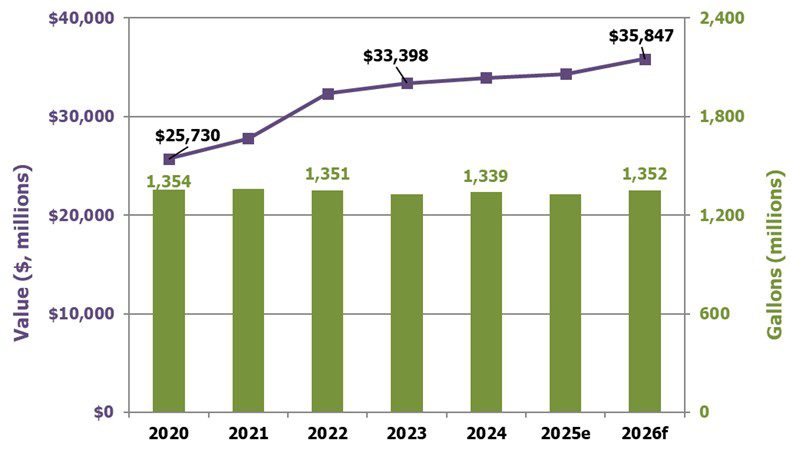
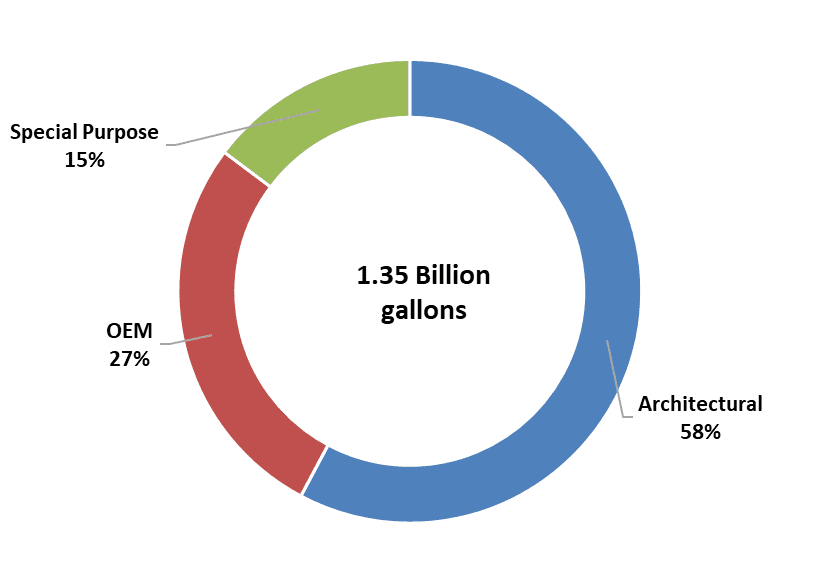
The year 2025e is suggesting a mixed outlook for the paint and coatings industry in the United States. The year 2024 ended with production of 1.34 billion gallons valued at $33.9 billion, up from 2023 by 0.9% in volume and 1.6% in value. The outlook for 2025e suggests a decrease of 0.8% in full-year production, totaling 1.33 billion gallons, and an increase of 1.1% in value to $34.3 billion, as shown in Figures 3-5.
(Sources: The ChemQuest Group, Inc. estimates; ChemQuest TraQr®)
(Sources: The ChemQuest Group, Inc.; ChemQuest TraQr®)
(Sources: The ChemQuest Group, Inc.; ChemQuest TraQr®)
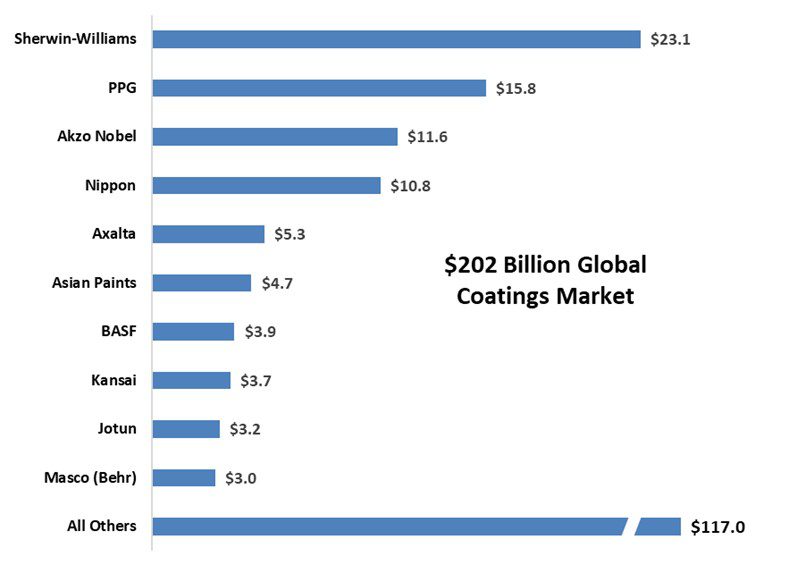
Aggressive consolidation over the past two decades has enabled the top 10 global coatings firms to collectively account for 42.1% of global sales in 2024. Furthermore, the top four global players accounted for 72% of the top 10 global coatings firms’ sales in 2024 (see Figure 6).
(Source: The ChemQuest Group, Inc. estimates)
Architectural Paints
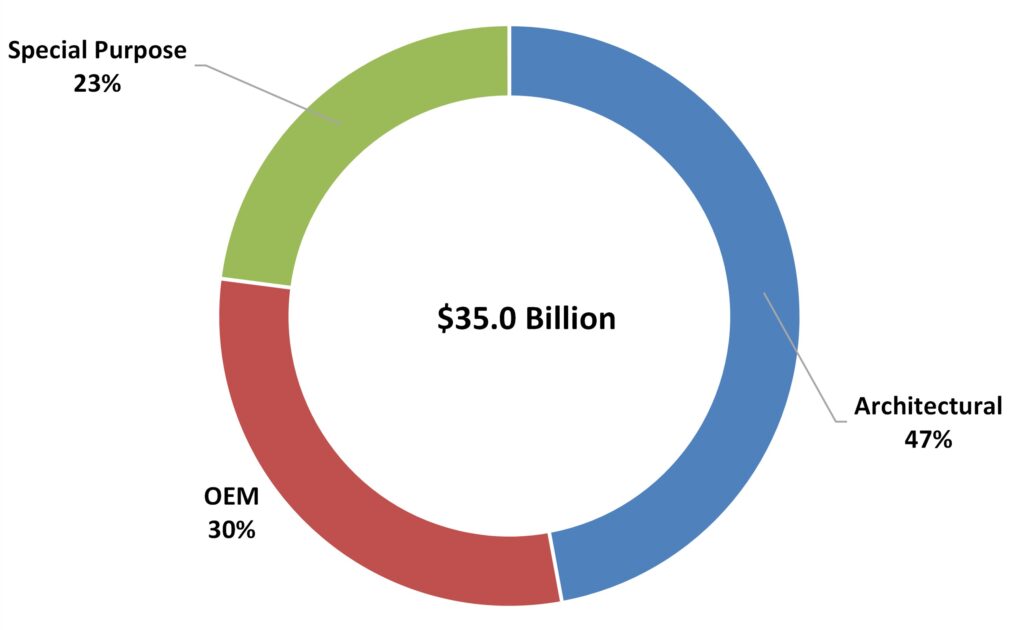
Architectural coatings sales are highly correlated with the health of the housing/construction market. Within the U.S. coatings industry,the architectural paints segment in 2024 accounted for 59% of the total coatings industry volume (one percent lower than in 2023) and 47% of the value (two percent lower than in 2023). We are projecting that volume and value of the architectural segment, as a percentage of the total coatings industry in 2025e, will remain the same for value, but drop two percentage points in volume, as shown inFigures 4 and 5.
Specifically for the Architectural segment, we anticipate a decline in growth in volume of 2.5% in 2025e and 0.9% in value. Looking forward to 2026f, we anticipate a volume increase of 1.7%, with a value increase of 3.9%, as shown in Figure 7.
(Sources: The ChemQuest Group, Inc. estimates; ChemQuest TraQr®)
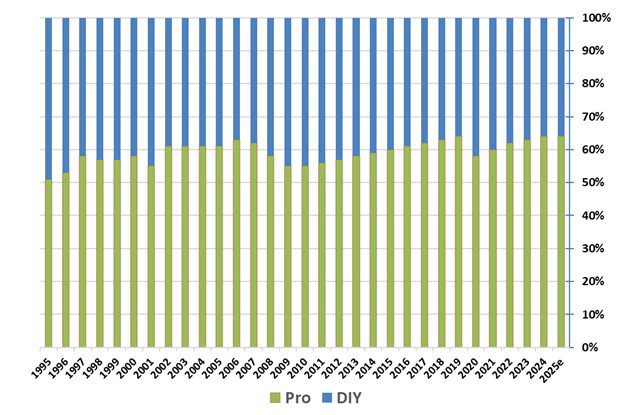
The “rollercoaster effect” has characterized the ratio of the amount of professionally applied (PRO-applied) paint to the amount of DIY paint for decades. The percentage of PRO-applied paint increased steadily from 2010 through 2019 and then dropped significantly during 2020, as homebound consumers decided to purchase paint and apply it themselves rather than hiring a PRO to do it for them. Following the flurry of homeowner painting activity in 2020, however, PRO regained essentially all of the lost ground in 2021 through 2024. We anticipate that the ratio will remain at 64% PRO:36% DIY in 2025e, helped by a stronger commercial building sector that helps counterbalance the weaker residential sector (see Figure 8).
(Source: The ChemQuest Group, Inc.)
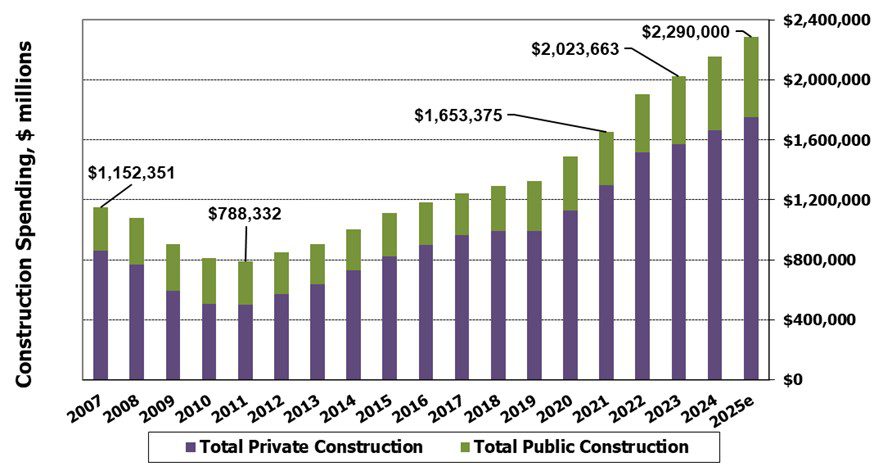
A major driver of the architectural coatings segment has historically been construction, which is closely correlated to coatings volume. Because U.S. construction continued its prolonged recovery in 2022 from the unprecedented low point it experienced in 2011, this trend would traditionally be expected to be good news for architectural paints and coatings—and so it has proven to be during the period 2020–2025e. Year-over-year growth in construction spending for 2024 was 6.6% but is anticipated to be very slightly lower (6.2%) during 2025e, for a total of $2.29 trillion. Despite concerns in some sectors about a potential recession, coupled with ongoing high interest rates and the steep growth in the cost of housing, we expect to see continued growth in construction, as shown in Figure 9.
(Source: The ChemQuest Group, Inc.)
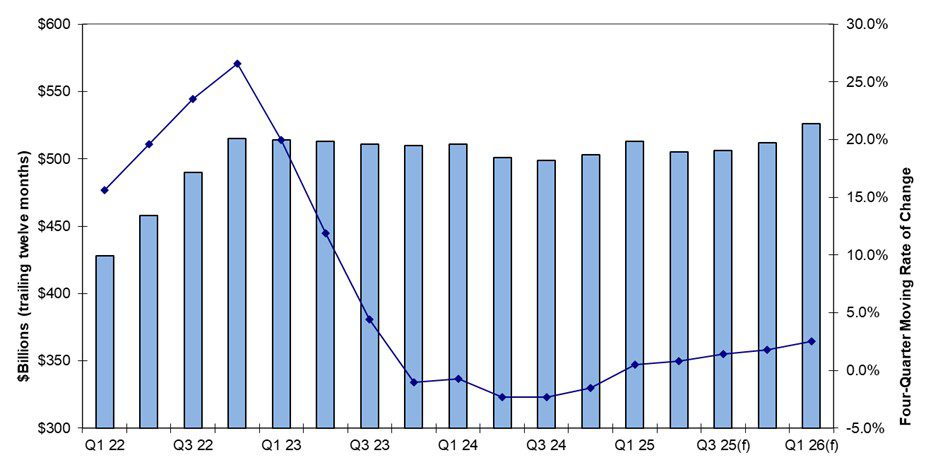
Remodeling has always been an additional driver for the architectural coatings segment, and activity in this area is monitored by the Joint Center for Housing Studies of Harvard University’s Leading Indicator of Remodeling Activity (LIRA). As shown in Figure 10, remodeling peaked at the end of 2022 and remained steady through the first quarter of 2024. It slowed for a few quarters and then showed some growth (positive rate of change) beginning in the first quarter of 2025. LIRA anticipates remodeling market growth through the remainder of 2025e into the first quarter of 2026 (see Figure 10).
(Sources: Joint Center for Housing Studies of Harvard University; The ChemQuest Group, Inc.)
Industrial OEM
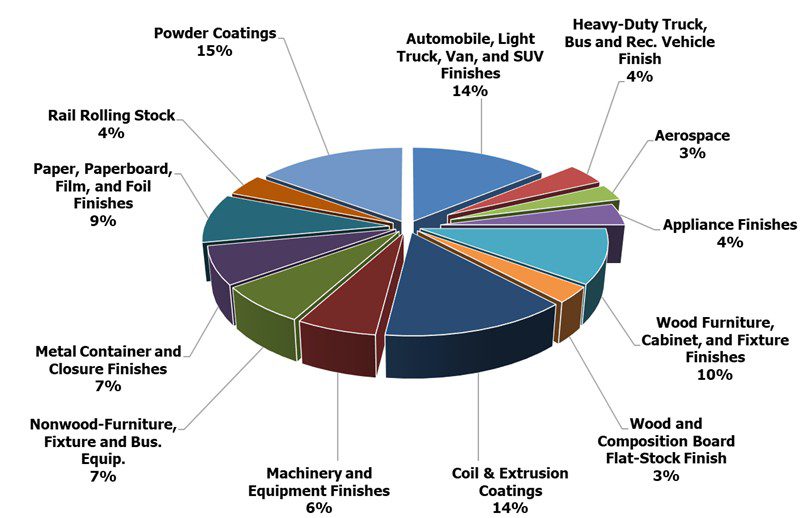
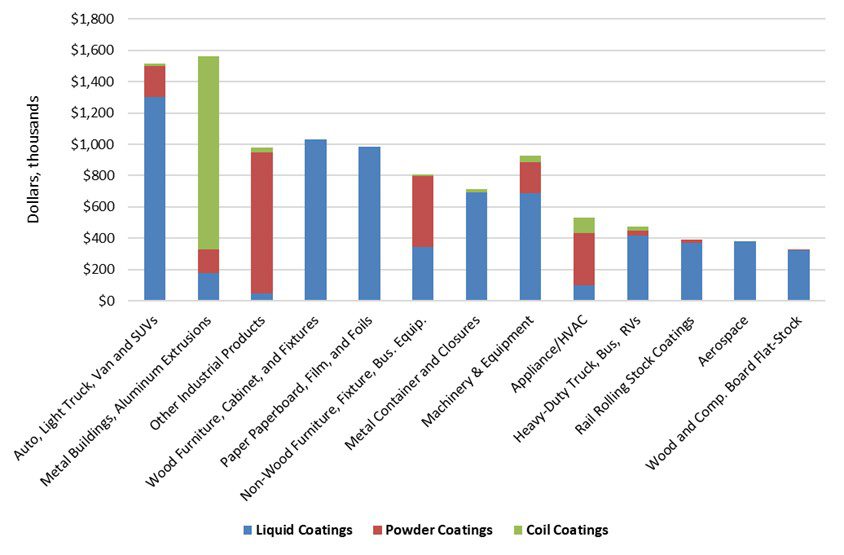
More than a dozen subsegments comprise the industrial OEM segment, the largest segments of which (by both volume and value) include: automotive OEM (including rigid and flexible automotive exterior trim systems and brake systems, et al.); coil coatings; wood furniture and cabinets; and powder coatings (see Figure 11). The industrial OEM segment tends to be driven by a variety of factors, as a result of such a diversity of goods, although most are influenced by the macroeconomic environment and especially by industrial production.
(Source: The ChemQuest Group, Inc. estimates)
The U.S. industrial OEM segment grew in value by 2.4% in 2024, generating $10.0 billion in sales while producing 364 million gallons. In 2025e, we expect to see an increase of 3.5% in value and 1.4% in volume, resulting in $10.3 billion in sales on 369 million gallons, as shown in Figure 12.
(Sources: The ChemQuest Group, Inc. estimates, ChemQuest TraQr®)
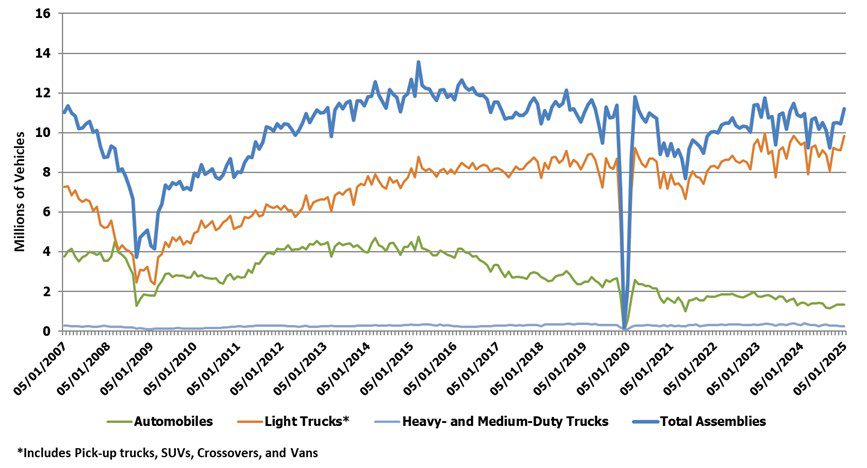
The automotive subsegment (defined as the total of domestic production, transplants, and imports of automobiles, light trucks, vans, and SUVs) peaked in mid-2015 and has not fully recovered.
From the shocking dip in September 2021 to the present, builds grew to 11.4 million units per month SAAR (seasonally adjusted, annualized rate), driven primarily by light trucks. Automobile (sedan) growth has been in a slow decline and is likely to remain that way throughout 2025e, given the increasing popularity of light trucks and SUVs (see Figure 13).
(Source: The ChemQuest Group, Inc.)
Harkening back to Figure 11, factory-applied coatings are divided over a number of markets, with two exceptions:
- Various powder coatings comprise 15% of the OEM market, unchanged from 2024, as indicated in Figure 11. There is, however, an additional 4% usage that falls under the categories for non-wood furniture and appliance finishes, which gives powder coatings an actual value share of 19%. While powder is an important coatings technology, it is not a market. A number of markets have gravitated to powder coatings over the years, including metal furniture, appliances, and automotive underbody, and powder is making incursions into extruded metal and a number of other market areas. Powder coatings have largely replaced solventborne liquid coatings in “job shop” applications. Nevertheless, we believe that the use of powder coatings has matured, and the combination of powders formulated for greater coverage, coupled with increased application efficiency, will slow its volume growth. From 2026 onward, we anticipate seeing flat, or even negative, growth in powder coatings.
- Coil-applied coatings and spray coatings for extruded metal make up 14% of the OEM market, down 1% from 2024. Coil coating is an application technique; however, its major targeted market area is metal building products, although it also has usage in appliance/HVAC, heavy-duty truck, bus, and RVs, as well as a few smaller areas. Spray-painted aluminum extrusions are most often used as a building product in conjunction with coil-coated metal, which is why this category is combined with coil coatings. It is helpful, however, to see the full array of market segments in which powder coatings and coil coatings are used, in the context of the major OEM industrial markets (see Figure 14).
(Source: The ChemQuest Group, Inc. estimates)
Trends in the industrial OEM market segment are driven by the desire for:
- Reshoring/nearshoring/friendshoring/ally-shoring certain raw materials to reduce dependency upon imported materials, especially those from regions of the world that are beset by political unrest.
- Creating operational efficiencies (e.g., increased productivity, reduced labor, or decreased cycle times)—fewer coating layers, thinner coating layers, greater availability of wet-on-wet systems.
- Increased sustainability (e.g., reduced CO2 footprint and product end-of-life reuse/disposal) and continual innovation (e.g., infrared reflectance, noise vibration, or insulation),etc.
- Robust functionality—ability to coat mixed-material substrates, composites, alloys, and other non-traditional surfaces that are being increasingly used for the purpose of lightweighting vehicles and equipment and to impart unique structural properties.
- Innovation—self-healing and self-cleaning coatings, self-stratifying coatings, coatings with “pollution-gobbling” properties, coatings that respond to stimuli by altering their properties (“smart coatings”), burnish- and scratch-resistant matte coatings, coatings with solar heat management, coatings with print-friendly surfaces, etc.
- Design and customization—increasing interest in made-to-order coatings to provide consumer engagement and for industrial coatings companies to differentiate themselves on both products and services.
Special Purpose Coatings
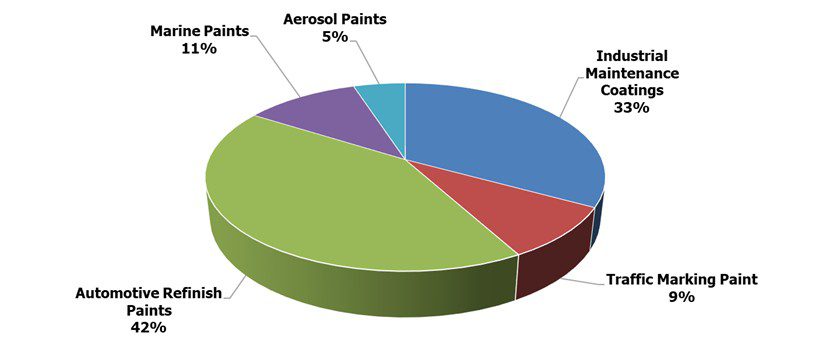
Industrial maintenance/protective coatings, automotive refinishing, traffic-marking paints, marine coatings, and aerosol paints comprise the major end markets for special purpose coatings, as shown in Figure 15. Far fewer end-market segments and subsegments comprise the special purpose coatings market segment than is the case with industrial OEM coatings, but special purpose coatings typically command higher overall margins than industrial OEM coatings.
(Source: The ChemQuest Group, Inc. estimates)
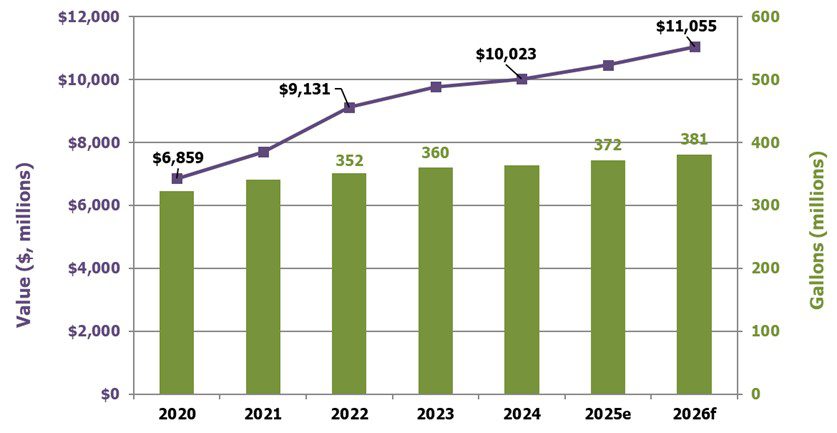
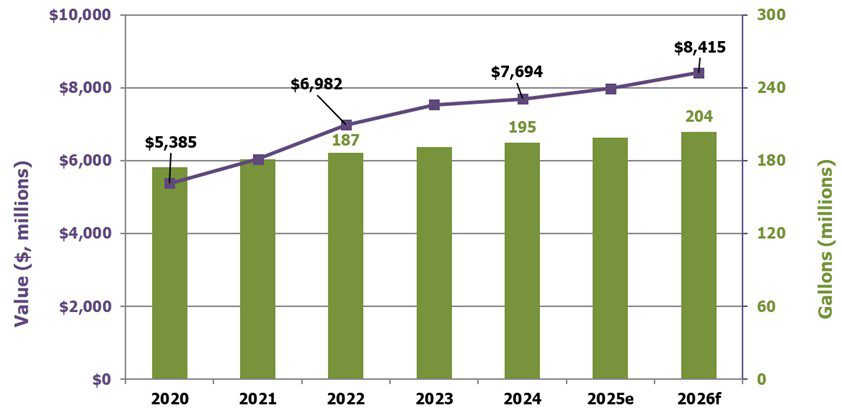
In 2024, special purpose coatings grew in value to $7.7 billion, which equates to 2.1% growth compared to 2023, and volume grew to 195 million gallons at a rate of 1.9%. In 2025e, we are expecting an increase in value of special purpose coatings to $8.0 billion, as volume increases to 199 million gallons (see Figure 16). This represents a forecasted sales increase (in dollars) of 3.7% and an increase of 2.1% in volume. In 2026f, we are forecasting $8.4 billion on 204 million gallons, for an increase in value of 5.4% and in volume of 2.5%.
(Sources: The ChemQuest Group, Inc.; ChemQuest TraQr®)
The largest segments comprising special purpose coatings are automotive refinish coatings and industrial maintenance/protective coatings. The former segment tends to track accident rates, total miles driven (see Figure 17), automotive sales, and size of the car parc (the total number of registered vehicles in use at any given time). The latter directly tracks industrial construction and maintenance of medium- and heavy-duty facilities such as wastewater treatment plants and petrochemical facilities—especially oil and gas (O&G), which represents approximately 30% of protective coatings volume—and infrastructure refurbishment. It also indirectly tracks global crude oil prices, which ranged from $55–$65 per barrel in 2019 for West Texas Intermediate (WTI) to $122 per barrel in mid-2022 and $62–$72 per barrel during H1 2025e. All else being equal, the U.S. Energy Information Administration expects the average for 2025e to come in at $65 per barrel.
(Sources: St. Louis Federal Reserve; The ChemQuest Group, Inc.)
During any given year, automotive refinish coatings sales are typically growing slightly or declining slightly, and predictions for the future either foresee slight growth or slight decline. The reason for such equivocal forecasts is that this market sector is constantly teetering on the brink of growth versus decline, depending upon which of a number of conflicting factors are in the ascendancy at any given time. Factors that tend to reduce automotive refinish coatings sales include (but are not limited to) improved education of the populace with regard to safer driving habits and the advent of safer, “smarter” cars that help with accident reduction and damage mitigation. This is accomplished with a continuous parade of collision-avoidance devices and systems such as energy-absorbing bumpers, back-up cameras, adjacent vehicle indicators, and automatic controls that keep cars from accidentally crossing the center line.
These safety measures are always countered to some degree by factors that favor increased usage of automotive refinish coatings—factors such as drivers talking, texting, and glancing at GPS screens while driving; increasing disposable incomes; changing lifestyles and buying behaviors; and demand for luxury vehicles, including crossovers and SUVs. This is not because either crossovers or SUVs—or their drivers—are more accident-prone than other cars and their drivers, but because luxury car owners tend to have scratches and minor dings repaired more readily than nonluxury vehicle owners.
U.S. sales of automotive refinish coatings were $3.17 billion on 41.9 million gallons in 2024, up 1.9% in value and 1.5% in volume over 2023, and are projected to increase in 2025e to $3.27 billion (+3.2%) on 42.4 million gallons (+1.2%). For 2026f, we are projecting sales of $3.45 billion (+5.5%) on 43.1 million gallons (+2.4%). Over time, however, we anticipate that the various factors that affect the use of automotive refinish coatings will begin to favor fewer accidents and other “need to repaint” scenarios, and that this market will begin trending downward at an estimated rate of 0.1–0.5% per year in volume during the period 2030-2040.
The industrial maintenance (IM) and protective coatings market segment represented 61.7 million gallons valued at $2.55 billion in 2024, an increase from 2023 of 2.0% by volume and 1.9% by value. We are predicting an increase in volume of protective coatings of 2.3% and an increase in value of 4.3% in 2025e, representing 63.1 million gallons valued at $2.66 billion, driven largely by construction and infrastructure. Going into 2026f, we anticipate growth over 2025e of 4.9% to $2.79 billion in value and 2.5% growth in volume to 64.7 million gallons.
Overall Industry Expectations for 2025e
At the end of the day, 2024 was a decent year for the U.S. coatings industry, despite the daily travails that were an unavoidable aspect of doing business for the entire year. Compared to 2023, 2024 sales were up 1.6% in value and 0.9% by volume. Because pricing outpaced volume, it is perhaps tempting to assume that coatings producers were able to keep ahead of raw material increases at an appropriate pace. While this may or may not be the case across the board, it was definitely the case on a producer-by-producer basis.
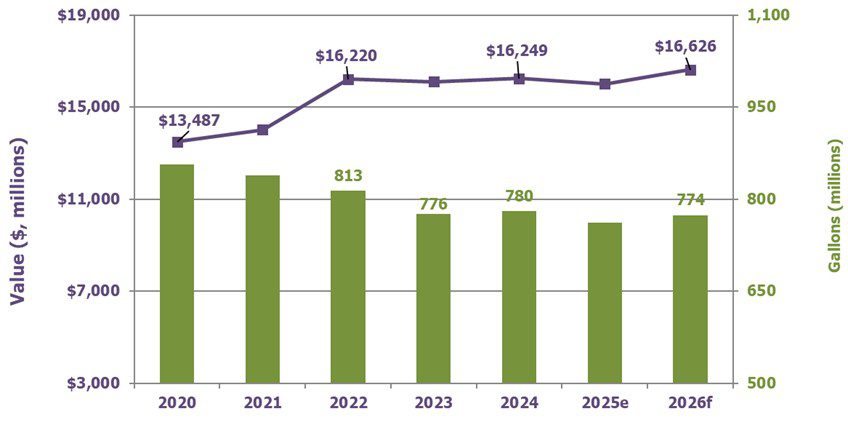
We estimate that 2025e, however, will be a different story. The weak housing market will push down volume in the U.S. paint and coatings market by 0.8%, although value will increase by 1.1%. The total value of the U.S. market is expected to be $34.3 billion on 1.33 billion gallons in 2025e. The U.S. paint and coatings industry remains large and relatively healthy—and the outlook for 2026f suggests that growth will continue at a slightly faster pace than in 2025e. We currently foresee a 1.8% growth in volume and a 4.4% growth in value in 2026f, representing 1.35 billion gallons valued at $35.8 billion. Things are clearly headed “back to normal,” but it is a “new normal,” not the same “normal” that prevailed in 2019.
What About the “New Normal”?
As we look back to December 2019, all seemed “normal” when judged by historic performance, and then COVID-19 hit, with its lockdowns and a plunging economy. In 2022, as the world was trying to extricate itself from two years of chaos and get back to work, decades of creating complex supply chains suddenly—and dramatically—demonstrated the downside of complexity. Critical imports were not reaching U.S. ports, and, when they did, there was insufficient intermodal capacity to move those materials from ports to production facilities across the country.
Demand quickly outpaced supply, and shipping prices rose as a result, which forced raw materials suppliers to increase their prices rapidly. In turn, coatings manufacturers were forced to raise their prices. The paint and coatings industry found itself enmeshed in a global supply chain crisis that virtually no one could have ever envisioned, even when projecting worst-case scenarios.
These are the conditions under which business in the United States experienced the transformation into a “new normal” characterized by many changes, both subtle and not-so-subtle, from the “old normal,” chief of which was the ongoing presence of moving targets in: tactical and strategic planning; supply chains; research and development programs; market studies; availability of labor, wages and salaries; and the migration of workers at all levels from “the office” to “the home.” The remote workforce is an issue that has many tentacles, especially given that only about 20% of employees who made the move to a home office in 2020 have moved back to “the office” permanently.[5] Another 50% are working in “hybrid” mode, and 30% have not returned at all. Even the phrase “back in the office” is a moving target because it lacks the same meaning that it did pre-pandemic. While a lot has improved in 2025e over the previous four years, we are still faced with a number of moving targets that are making life complicated for everyone.
A Brief Word About Tariffs
We are hearing about tariffs and rumors of tariffs, but it is important to remember that tariffs come, and tariffs go—very rarely are they permanent at anything other than a nominal level. Multiple studies of the long-term effects of tariffs in the 20th and into the 21st centuries indicate that, with only a few exceptions, tariffs do more harm than good. Though they may provide short-term relief and often give the public a psychological “high,” tariffs typically act as painkillers—and like painkillers, they just give temporary relief. The March 2018 U.S. tariffs on steel and aluminum increased costs by $51 billion/year—a burden shouldered principally by U.S. companies and consumers. Evaluations of the results of these tariffs in November 2019 by both the U.S. Secretary of Commerce and the Federal Reserve Board of Governors indicated that by mid-2019, 1,000 jobs were added to the steel industry, but 75,000 jobs were lost among industries using steel.[6] How the current situation will play out is basically anybody’s guess, but tariffs do not have history going in their favor. . . .
Strategic Planning: Dealing with Moving Targets
The principal value of history is that it generates lessons, typically along with an understanding of the tools and ideas needed to create a better future. For this reason, we must learn from “former normals” what worked, what failed to work, and why.
The global supply chain issues that were experienced during the period 2021-2024 were exposed by the global pandemic but were not caused by it. We have been living dangerously close to the edge for many years without acknowledging it. Our global supply chains lack fundamental resilience, and, while they appeared to have improved in 2023 and 2024, it will only be 2026f or later that we will be able to determine what permanent changes were made and to what degree they were efficacious.
To varying degrees, some steps are certainly underway by individual governments and businesses within the manufacturing sector to bring greater resilience to the overall process. Much needs to be rethought, however, with regard to:
- Ordering procedures—JIT can work for only a single link in the value chain, and that has proven to be not just its “weak link,” but its Achilles’ heel, as well. The honeymoon with JIT is officially over.
- Logistics, both intra-regional and global
- Sourcing methods, both numerical and geographical
- Patterns and timing
- The relationship between “make and ship” and “make and hold”
- Inventory control, both raw materials and finished goods
- Cost of energy
- Many other aspects of the concept represented by the term “supply chain”
Most importantly, it should be our fervent hope that we have learned the value of having a business strategy. We cannot just talk about creating a strategy; we must create one for every business in the paint and coatings market supply chain. For the long-term good of our businesses, as well as the continued confidence of our investors, we absolutely must be using our recent history to guide the creation of a strategy that will move us “back from the edge” so that future surprise events will not have such a debilitating effect on our individual companies and on the U.S. economy in general.
Going Forward
At the end of the day, it will be effective strategy that separates the winners from the losers. Full stop. Whether raw material and paint and coatings producers create their strategies and new products “in-house” or work with outside partners—strategic business advisers, technology consultants, independent laboratories, universities, individual subject matter experts, or all of the foregoing—meaningful strategy must be considered honestly, openly, carefully, and, most of all, seriously.
In the changing world in which we live, in-house assets are increasingly challenged and easily overwhelmed, R&D pipelines are too long, tactical concerns relegate new product development to the back burner, and research staff is operating under the negative effects of stress. Strategic product development must either involve the expansion of current R&D staff or the use of outside know-how and expertise to augment internal efforts. Fortunately, it is both possible and profitable to take this latter approach, but overcoming “NIH Syndrome” (“not invented here”) is not always easy to accomplish. For those raw material and coatings producers who are able to do so, however, the rewards have proven to be significant.
Independent third-party individual knowledge experts, strategic consulting firms, and technology organizations are able to bring extensive knowledge in multiple fields of specialty chemicals to bear on the advancement and cross-fertilization of technology at both raw material suppliers and coatings producers. This approach is well worth doing “whatever it takes” to rid manufacturing companies of NIH Syndrome and embrace a wider world of technology experience and know-how.
To learn more, reach out to the author at gpilcher@chemquest.com.
References
- “How Business Leaders Can Proactively Navigate Geopolitics,” McKinsey & Co., https://www.mckinsey.com/featured-insights/mckinsey-live/webinars/how-business-leaders-can-proactively-navigate-geopolitics (accessed July 22, 2025).
- “U.S. Utilization of Refinery Capacity,” YCharts, ycharts.com/indicators/us_operable_crude_oil_distillation_capacity#:~:text=Level%20Chart,long%20term%20average%20of%2089.64%25 (accessed July 22, 2025).
- “U.S. refinery capacity largely unchanged as of January 2025,” U.S. Energy Information Administration, June 2025, eia.gov/todayinenergy/detail.php?id=65624 (accessed July 22, 2025).
- “The Business of Chemistry by the Numbers,” American Chemistry Council, americanchemistry.com/chemistry-in-america/data-industry-statistics/the-business-of-chemistry-by-the-numbers (accessed July 22, 2025).
- “Hybrid Work,” Gallup, Inc., gallup.com/401384/indicator-hybrid-work.aspx#:~:text=Line%20graph%20showing%20current%2C%20expected,prefer%20to%20work%20on%2Dsite (accessed July 22, 2025).
- Kadee R.; Cox, L., “Steel Tariffs and U.S. Jobs Revisited,” EconoFact, 2020, econofact.org/steel-tariffs-and-u-s-jobs-revisited (accessed July 22, 2025).