Table of Contents
Could any of us have predicted in 2019 that, in 2023, everyone would be preoccupied with lower but still unacceptably high inflation, unprecedented rate hikes by the Federal Reserve, the nearly year-and-a-half Russian aggression against the sovereign State of Ukraine that has led to global energy fears, and the refocusing of the American vision of China from “trading partner” to “potential enemy?” Whether or not we saw them coming, each of these situations has affected the paint and coatings business globally, and the negative side effects are not going away tomorrow.
Although the industry recovered in 2021 from a 2020 dip in volume, the real news is the dramatic increase in value (~25% over the two-year period 2021-2023 estimated (2023e)) that has resulted from the high cost of crude, decreasing (but not completely halted) global supply chain issues, remnant shortages, improved (but not back to pre-2020 levels) transportation/logistics issues, and labor shortages. All have led to galloping inflation that the chairman of the Federal Reserve feels will likely require at least two more rate hikes this year.
As of mid-2023, most raw material suppliers and coatings producers are able to produce sufficient material to fill their orders, though often with lead times that are longer than was the case just four years ago. Some raw material suppliers are sold out through the end of 2024, but paint producers seem to be back on a course that is trickier to navigate than in years past and definitely requires more foresight and strategy. R&D staffs at both raw material producers and paint manufacturers are still spending time, albeit less time than they did during the past two years, working defensively to make sure that they are prepared for raw material shortages that affect existing products, rather than offensively by creating the new and/or improved products that are the heart and soul of all manufacturing firms.
The hard truth, however, is that this is going to be necessary going forward, because the global supply chain has become increasingly fragile and is susceptible to damage more readily than in the past. The supply chains of our global economy are increasingly vulnerable and more easily disrupted than ever before, whether from the Russo-Ukrainian War (including the potential for NATO to intervene at some point), political tensions between the West and Russia/China, a slowdown in the Chinese economy,[1] issues involving Türkiye’s relationships with both the EU and NATO, the actions that will be taken by various countries with regard to the PFAS issue, or any number of other factors in a globe characterized by contention, distrust, and an increasingly vocal consumer involvement with everything from global climate change and chemical awareness to microplastics in the environment.
The Relationship of Crude Oil to the U.S. Paint and Coatings Industry, 2022-2024f
Each $10 increase in Brent crude results in a 3% increase in overall costs to coatings producers, representing an important factor in the overall dynamics and profitability of the paint and coatings industry. Understanding what is happening now and what is likely to happen in the near- and longer-term future of crude oil production is necessarily an important component of the creation of meaningful strategy for paint makers worldwide.
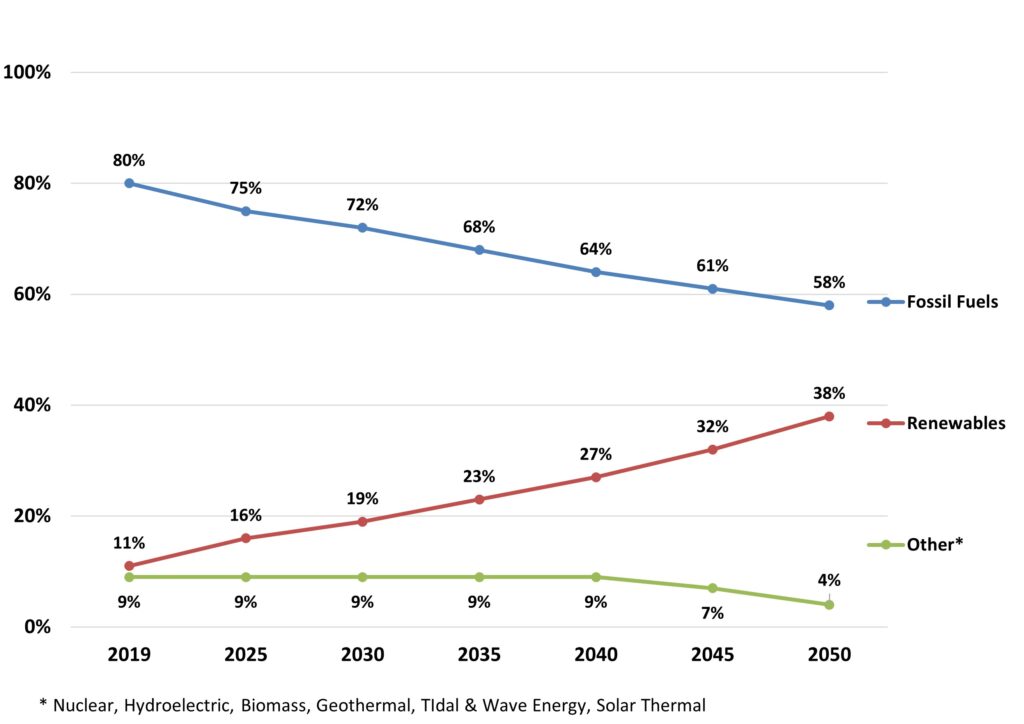
This year, U.S. refinery capacity is running at 91-92% of capacity, which is higher than the long-term average of 89-90% but lower than 2022’s 94-95%.[2] This is partly due to the closure of a small facility earlier this year, reducing the number of U.S. refineries from 130 to 129, but this is not a major factor. The decline in capacity utilization is due to a multiplicity of factors, most of which—like the unusually warm winter in 2022-2023—are localized occurrences. However, there is no doubt that, in the longer term, the percentage of energy from fossil fuel products will be in very gradual decline (roughly negative 4% per year) between now and 2050, as renewables increase their share at a slightly greater rate of 4-5% per year. Energy from nuclear, biomass, hydrothermal, geothermal, tidal and wave, and “solar thermal” (which is not to be confused with “solar”) will maintain a small but steady presence for the coming 15 years or so, beginning to decline in roughly 2040, as shown in Figure 1.
(Sources: bp Energy Outlook 2023 Edition; The ChemQuest Group, Inc.)
There do not appear to be plans to increase capacity anytime soon, nor would that be a particularly logical move, given that the use of chemicals made from crude oil is in decline. We see it as good news in the short term, however, that LyondellBasell Industries, which had announced last year that it would shutter its 264,000 barrels/day Houston facility in 2023, has now extended the closing date to the first quarter of 2025.[3] We live in turbulent times, and one never knows when there is going to be a sudden run on crude—we’ve seen examples in just the past two decades.
For the long-term national good, a decline in crude oil refining is, of course, excellent news. It is a bit more problematic in the short term, however. The U.S. chemical industry represents a $486 billion enterprise that supports more than 25% of total U.S. gross domestic product (GDP), supports the production of almost all commercial and household goods, and is essential to economic growth.[4] Everything from pharmaceuticals to cosmetics, fertilizers to paints and coatings lies downstream from crude oil. Many basic raw materials for all types of coatings, whether waterborne or solventborne, 100% solids, powder, or energy-curing systems, are derived from crude oil. In the overall scheme of things, we should see some easing of both supplies and prices of paint and coatings raw materials based on fossil fuels, but this will not, of course, have any salutary effects on the cost and difficulty of obtaining labor, higher energy costs, logistics costs, or raw materials that are not derived from fossil fuels (e.g., mined pigments).
Ultimately, the post-pandemic U.S. paint and coatings industry is doing reasonably well. There will continue to be structural global issues that will mitigate against any scenarios in which “things return to [former] normal,” but the value of the U.S. paint and coatings industry in mid-2023e is +5.3% compared with mid-2022, although volume is down by 1.5%. This seems both understandable and reasonable, given what the industry has been through during the past several years.[5] With this in mind, what should we expect in 2023e and 2024 forecast (2024f)?
The State of the U.S. Paint and Coatings Industry, 2022-2024f
The author and The ChemQuest Group, Inc., closely follow the global paint and coatings industry in order to produce articles such as this, as well as various industry presentations throughout the year. In addition, our new Coatings TraQr™ resource provides subscribers with access to regularly updated global market and economic information. Drawing upon the deep knowledge that is resident within ChemQuest’s databases, Coatings TraQr™, and experienced personnel, it is time to look at the “State of the U.S. Paint and Coatings Industry.” First, however, it is necessary to place our industry in the proper context by assessing the macroeconomic picture that surrounds all businesses that depend upon the specialty chemical stream for their livelihood.
In turbulent times (e.g., the COVID-19 pandemic, supply chain issues, runaway inflation, escalating interest rates), quarterly GDP data can be confusing. When COVID-19 became a household word in Q1 2020, GDP dropped about 5% versus the previous quarter and then plummeted in Q2 by 33%. Unsurprisingly, it rocketed up in Q3 to 34% as employees in many industries got back to work, but this was hardly an indication that the U.S. economy was out of the woods.[6]
The year 2021 returned to something more “normal-looking”—GPD was 5.9%. But that did not last, as inflation took over and the Federal Reserve needed to increase interest rates. GDP in 2022 was 2.1%; for Q1 2023, it came in at 2.0%[7] and is estimated at +2.1% in the second quarter, giving us four consecutive quarters of expansion.
An increase in consumer spending reflected increases in both goods and services, led by motor vehicles and by services such as health care, food services, and accommodations. Within exports, an increase in goods (led by consumer goods, except food and automotive) was partly offset by a decrease in services (led by transport). Within federal government spending, the increase was led by nondefense spending.[7] Lacking a crystal ball, this author has few indications that a full-blown recession is in our immediate future, although there are still two Fed rate hikes on the horizon for 2023.
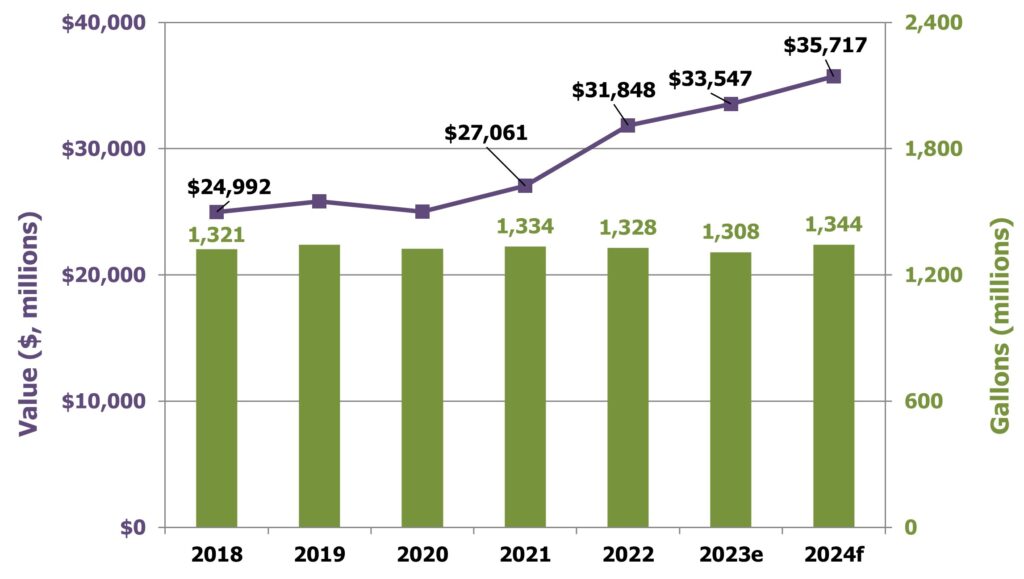
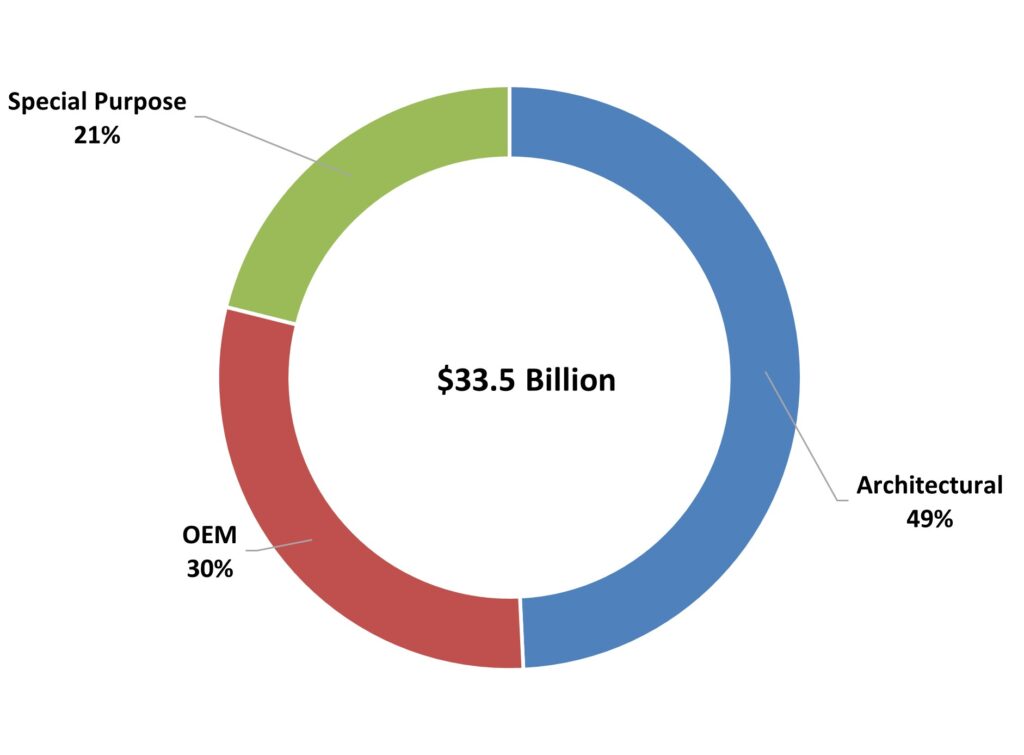
The year 2023 is expected to be a mixed year for the paint and coatings industry in the United States. The year 2022 ended with production of 1.33 billion gallons valued at $31.8 billion, down from 2021 by 0.4% in volume but up 17.7% in value. The outlook for 2023e suggests a continued and slight decline in full-year production, totaling 1.31 billion gallons, and an increase in value to $33.5 billion, as shown in Figures 2-4.
(Sources: The ChemQuest Group, Inc., estimates; Coatings TraQr™)
(Sources: The ChemQuest Group, Inc.; Coatings TraQr™)
(Sources: The ChemQuest Group, Inc.; Coatings TraQr™)
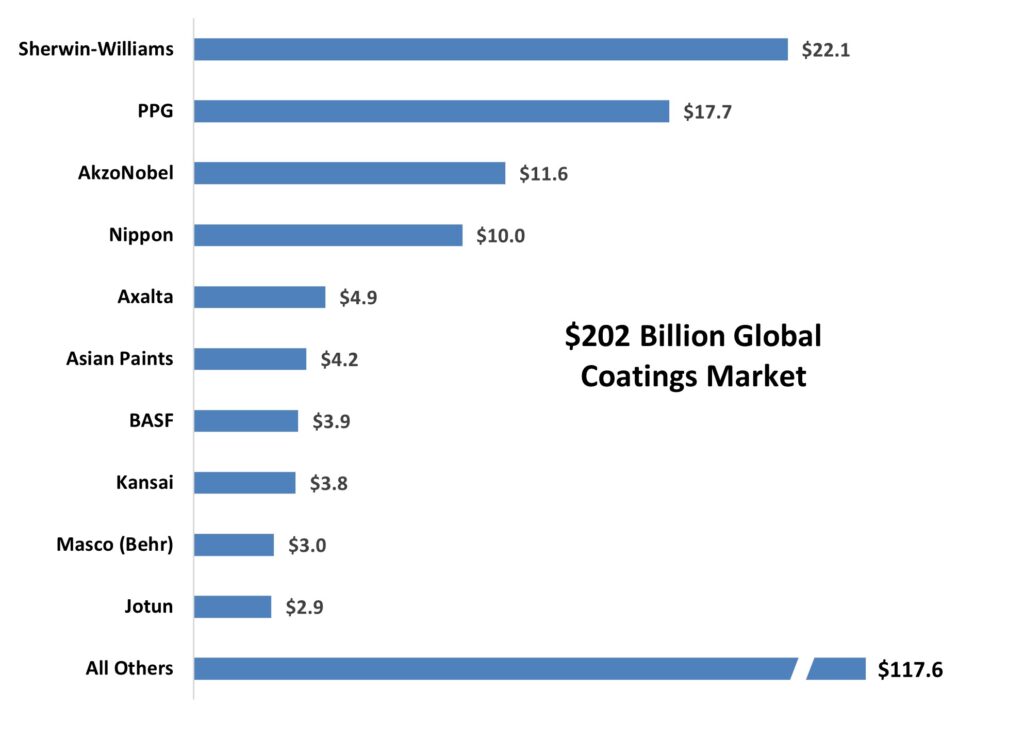
Aggressive consolidation over the past two decades has enabled the top 10 global coatings firms to collectively account for 41.7% of global sales in 2022. Furthermore, the top four global players accounted for 73% of the top 10 global coatings firms’ sales in 2022 (Figure 5).
( Source: The ChemQuest Group, Inc., estimates)
Architectural Paints
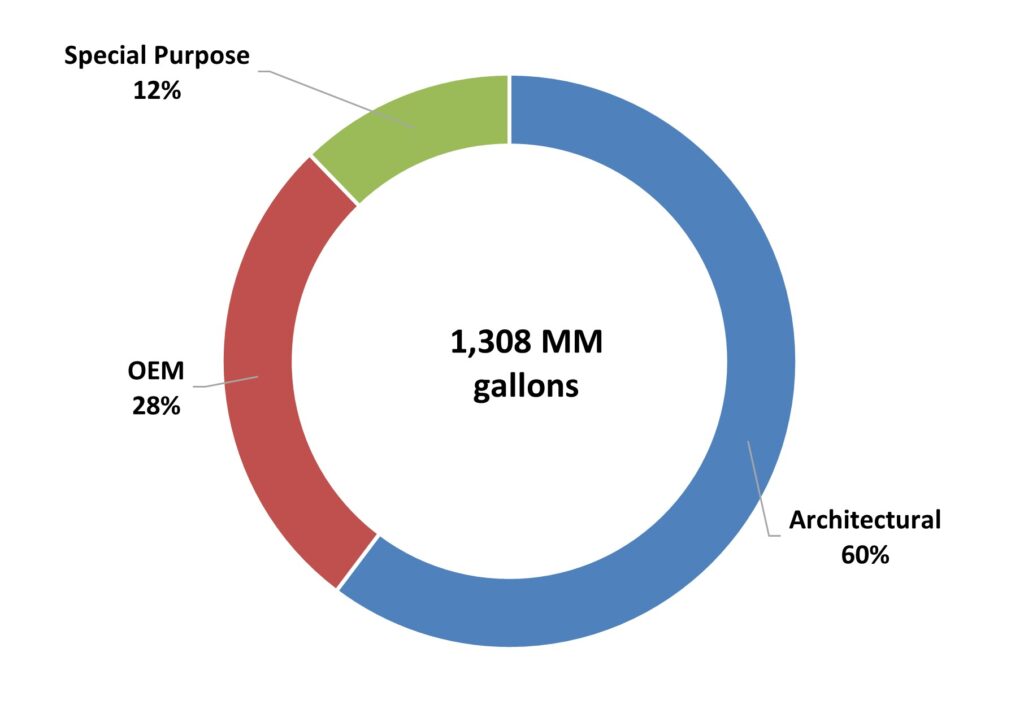
Architectural coatings sales are highly correlated with the health of the housing/construction market. Within the U.S. coatings industry, the architectural paints segment currently accounts for 60% (down from 63% in 2021) of the volume and 49% (down from 52% in 2021) of the value, as shown in Figures 3 and 4.
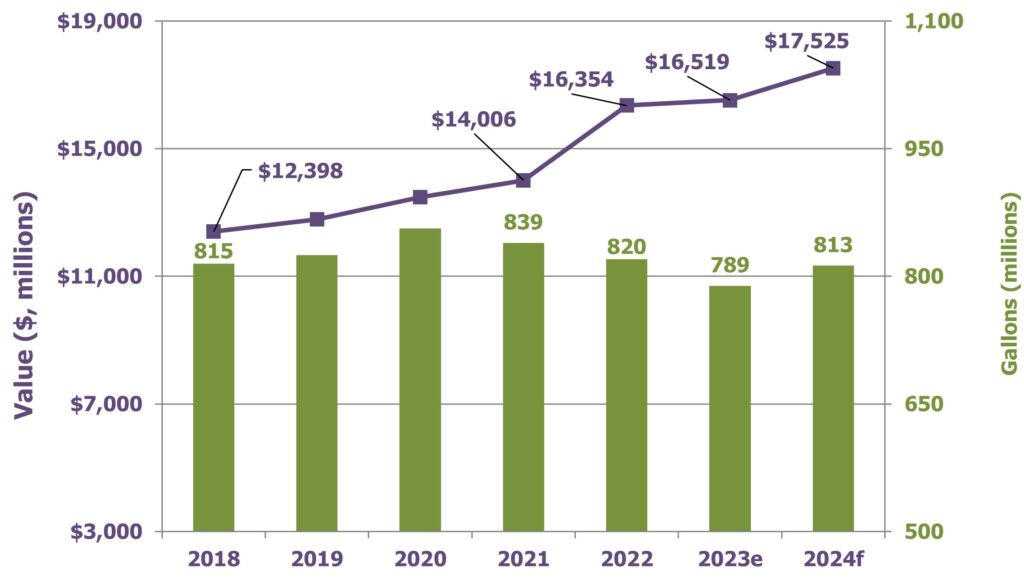
Due to the severe supply chain issues in 2021 and the accompanying raw material price increases, architectural coatings grew 16.8% in value in 2022 compared to its value in 2021, but the volume decreased by 2.3% in 2022 compared to its volume in 2021. We anticipate a continued drop in volume during 2023e and estimate a decrease of 3.8%. Value, however, is expected to see a slight increase of 1.0% for 2023e. Looking forward to 2024f, we anticipate a volume increase of 3.0%, with a value increase of 6.1%, as shown in Figure 6.
(Sources: The ChemQuest Group, Inc., estimates; Coatings TraQr™)
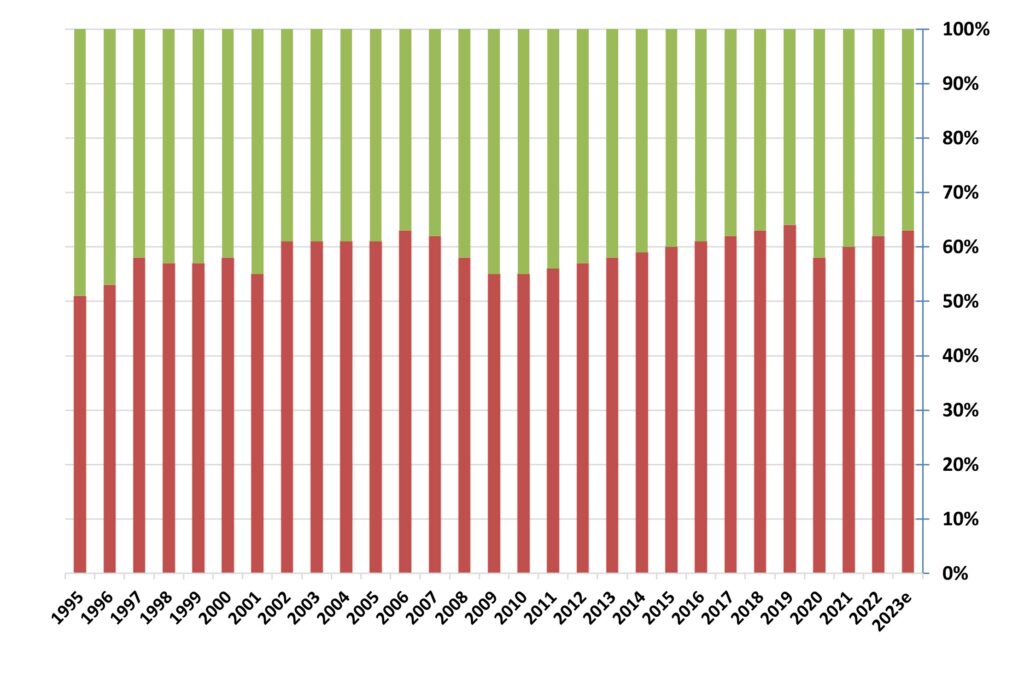
The “rollercoaster effect” has characterized the ratio of the amount of professionally applied (PRO-applied) paint to the amount of DIY paint for decades. The percentage of PRO-applied paint increased steadily from 2010 through 2019 and then dropped significantly during 2020, as homebound consumers decided to purchase paint and apply it themselves rather than hiring a PRO to do it for them. Following the flurry of homeowner painting activity in 2020, however, PRO came roaring back from 2021 through 2023e. We anticipate that the ratio will be back up to 63% PRO:37% DIY in 2023e, helped by a strong commercial building sector that helps counterbalance the weaker residential sector (Figure 7).
(Source: The ChemQuest Group, Inc.)
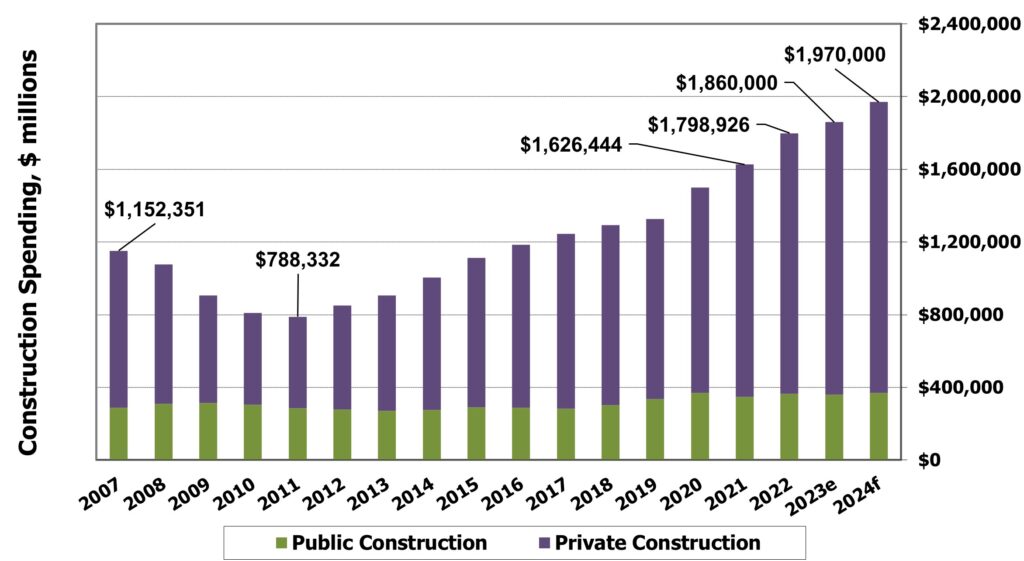
A major driver of the architectural coatings segment has historically been construction, which is closely correlated to coatings volume. Because U.S. construction continued its prolonged recovery in 2022 from the unprecedented low point it experienced in 2011, this trend would traditionally be expected to be good news for architectural paints and coatings, but it has not proven to be so during the period 2020-2024f. Year-over-year growth in construction spending for 2022 was 10.6% and is anticipated to increase by an additional 3.4% during 2023e, for a total of $1.76 trillion. Despite concerns in some sectors about a potential recession, coupled with even higher interest rates and the steep growth in the cost of housing, we expect to see continued growth in construction of just under 6% in 2024f, as shown in Figure 8.
(Source: The ChemQuest Group, Inc.)
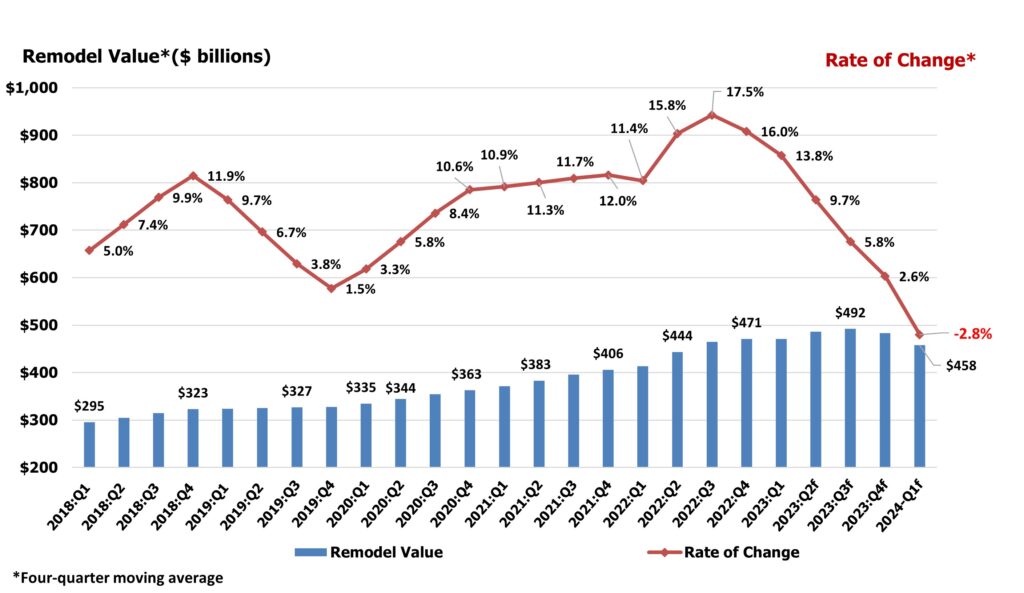
Remodeling has always been an additional driver for the architectural coatings segment, and activity in this area is monitored by the Joint Center for Housing Studies of Harvard University’s Leading Indicator of Remodeling Activity (LIRA). As shown in Figure 9, 2018 and 2019 were strong for remodeling but really gained steam in 2020, followed by a bit of a breather in 2021 before experiencing another surge during the first half (H1) of 2022. Industry observers had expected remodeling activity to plateau at a high level of activity or even increase in 2023e, but a steep decline began in the second half (H2) of 2022. LIRA is now anticipating a deceleration in remodeling market growth through the remainder of 2023 and further predicts negative growth at least through the first quarter of 2024 (Figure 9).
(Sources: Joint Center for Housing Studies of Harvard University; The ChemQuest Group, Inc.)
Industrial OEM
More than a dozen subsegments comprise the industrial OEM segment, of which major appliances; agricultural equipment; fireplaces; HVAC; automotive OEM (including rigid and flexible automotive exterior trim systems and brake systems, et al.); extruded metal for curtain wall; coil coatings; wood furniture and cabinets; and metal furniture and fixtures are a few representative coatings areas (Figure 10). The industrial OEM segment tends to be driven by a variety of factors, as a result of such a diversity of goods, although most are influenced by the macroeconomic environment and especially by industrial production.
(Source: The ChemQuest Group, Inc., estimates)
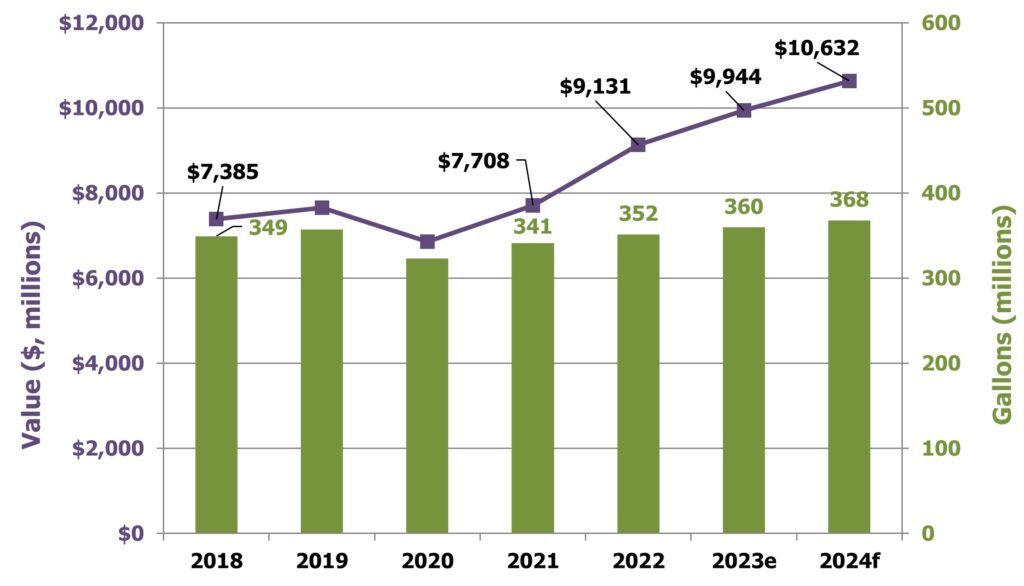
The U.S. industrial OEM segment grew in value by 18.5% in 2022, generating $9.1 billion in sales while producing 352 million gallons. In 2023e, we expect to see an increase of 8.9% in value and 2.3% in volume, resulting in $9.9 billion in sales on 360 million gallons, as shown in Figure 11.
(Sources: The ChemQuest Group, Inc. estimates, Coatings TraQr™)
The automotive subsegment (defined as the total of domestic production, transplants, and imports of automobiles, light trucks, vans, and SUVs) enjoyed a year of significant improvement during 2022, albeit not a return to the stellar performance that it managed to produce during the halcyon period between 2014 and 2017.
From the dip in September 2021 to the present, builds grew to 11.4 million units per month SAAR (seasonally adjusted, annualized rate), driven primarily by light trucks. Automobile growth (which includes SUVs) has been essentially flat for 2023e and is likely to remain that way into 2024, given the increasing popularity of light trucks (Figure 12).
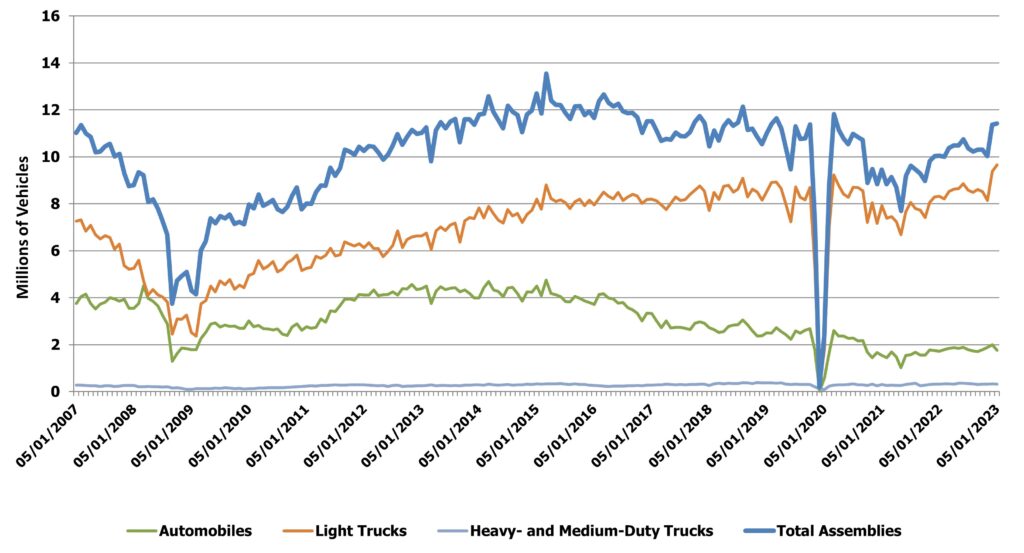
(Source: The ChemQuest Group, Inc.)
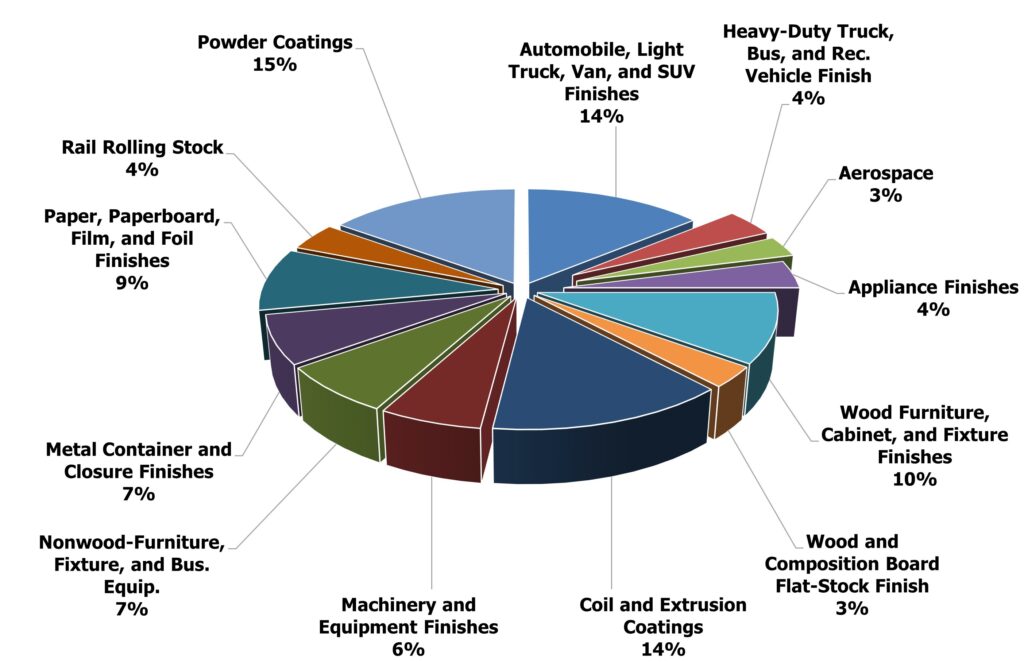
Harkening back to Figure 10, factory-applied coatings are divided over a number of markets, with two exceptions:
- Various powder coatings comprise 19% of the OEM market. While this is an important coatings technology, it is not a market. A number of markets have gravitated to powder coatings over the years, including metal furniture, appliances, and automotive underbody, and powder is making incursions into extruded metal and a number of other market areas. Powder coatings have largely replaced solventborne liquid coatings in “job shop” applications.
- Coil-applied coatings and spray coatings for extruded metal make up 15% of the OEM market. Coil coating is an application technique; however, its major targeted market area is metal building products, although it also has usage in appliance/HVAC, heavy-duty truck, bus, and RVs, as well as a few smaller areas. Spray-painted aluminum extrusions are most often used as a building product in conjunction with coil-coated metal, which is why this category is combined with coil coatings. It is helpful, however, to see the full array of market segments in which powder coatings and coil coatings are used, in the context of the major OEM industrial markets (Figure 13).
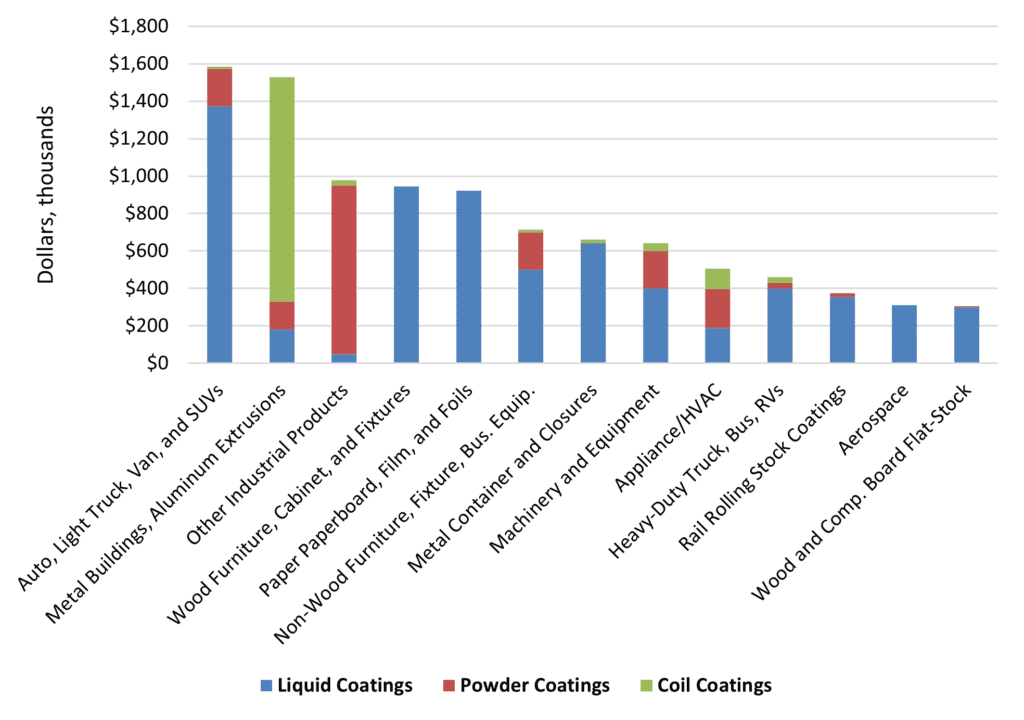
(Source: The ChemQuest Group, Inc., estimates)
Trends in the industrial OEM market segment are driven by the desire for:
- Reshoring certain products to reduce dependency upon imported materials.
- Creating operational efficiencies (e.g., increased productivity, reduced labor, or decreased cycle times)—fewer coating layers, thinner coating layers, greater availability of wet-on-wet systems.
- Increased sustainability (e.g., reduced CO2 footprint and product end-of-life reuse/disposal) and continual innovation (e.g., infrared reflectance, noise vibration, or insulation),etc.
- Robust functionality—ability to coat mixed-material substrates, composites, alloys, and other non-traditional surfaces that are being used for the purpose of lightweighting vehicles and equipment and to impart unique structural properties.
- Innovation—self-healing and self-cleaning coatings, self-stratifying coatings, coatings with pollution-eating properties, coatings that respond to stimuli by altering their properties (“smart coatings”), burnish- and scratch-resistant matte coatings, coatings with solar heat management, coatings with print-friendly surfaces, etc.
- Design and customization—increasing interest in made-to-order coatings to provide consumer engagement and for industrial coatings companies to differentiate on services.
Special Purpose Coatings
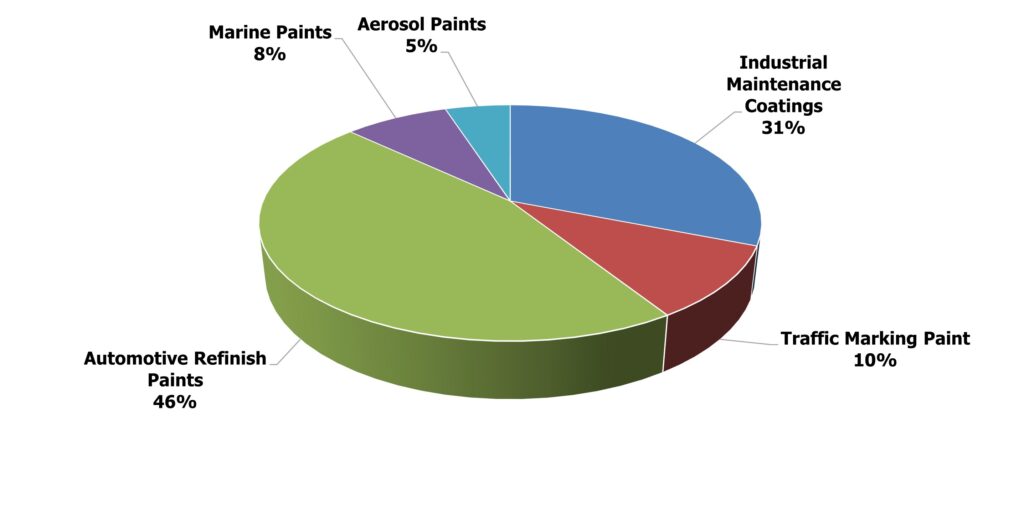
Industrial maintenance/protective coatings, automotive refinishing, traffic-marking paints, marine coatings, and aerosol paints comprise the major end-markets for special purpose coatings, as shown in Figure 14. Far fewer end-market segments and subsegments comprise the special purpose coatings market segment than is the case with industrial OEM coatings, but special purpose coatings typically command higher overall margins than industrial OEM coatings.
(Source: The ChemQuest Group, Inc., estimates)
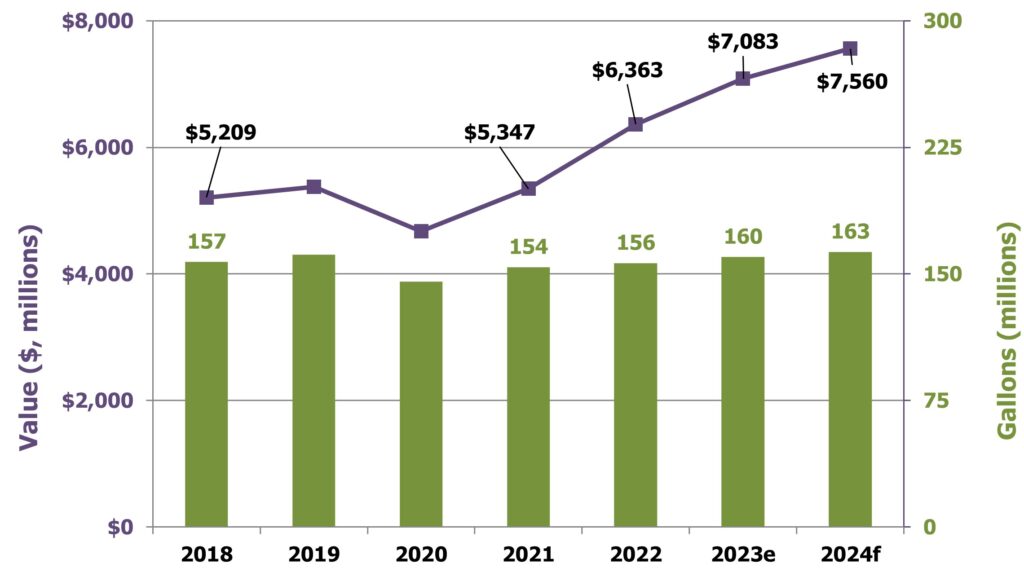
In 2022, special purpose coatings grew in value to $6.4 billion, which equates to 19.0% growth compared to 2021, and volume grew to 156 million gallons at a rate of 1.2%. In 2023e, we are expecting an increase in value of special purpose coatings from $6.4 billion to $7.1 billion, as volume increases from 156 million to 160 million gallons (Figure 15). This represents a forecasted sales (in dollars) increase of 11.3% and an increase of 2.6% in volume. In 2024f, we are forecasting $7.6 billion on 163 million gallons, for an increase in value of 6.7% and in volume of 1.9%.
(Sources: The ChemQuest Group, Inc.; Coatings TraQr™)
The largest segments comprising special purpose coatings are automotive refinish coatings and industrial maintenance/protective coatings. The former segment tends to track accident rates, total miles driven (Figure 16), automotive sales, and size of the car parc (the total number of registered vehicles in use at any given time). The latter directly tracks industrial construction and maintenance of medium- and heavy-duty facilities such as wastewater treatment plants and petrochemical facilities—especially oil and gas (O&G), which represents ~ 30% of protective coatings volume—and infrastructure refurbishment. It also indirectly tracks global crude oil prices, which ranged from $55-$65/barrel in 2019 for West Texas Intermediate (WTI) to $122/barrel in mid-2022 and $68-$80/barrel during H1 2023e.
(Sources: St. Louis Federal Reserve; The ChemQuest Group, Inc.)
During any given year, automotive refinish coatings sales are typically growing slightly or declining slightly, and predictions for the future either foresee slight growth or slight decline. The reason for such equivocal forecasts is that this market sector is constantly teetering on the brink of growth vs. decline, depending upon a number of conflicting factors being in the ascendancy at any given time. Factors that tend to reduce automotive refinish coatings sales include (but are not limited to) improved education of the populace with regard to safer driving habits and the advent of safer, “smarter” cars that help within accident reduction and damage mitigation with an assortment of collision-avoidance devices and systems (e.g., energy-absorbing bumpers, back-up cameras, adjacent vehicle indicators, and automatic controls that keep cars from accidentally crossing the center line).
These safety measures are always countered to some degree by factors that favor increased usage of automotive refinish coatings—factors such as drivers talking, texting, and glancing at GPS screens while driving; increased disposable income; changing lifestyle and buying behavior; and demand for luxury vehicles, including crossovers and SUVs. This is not because either crossovers or SUVs—or their drivers—are more accident-prone than other cars and their drivers, but because luxury car owners tend to have scratches and minor dings repaired more readily than non-luxury vehicle owners.
U.S. sales of automotive refinish coatings were $2.9 billion on 40 million gallons in 2022, up 18.9% in value and 2.5% in volume over 2021, and are projected to increase in 2023e to $3.2 billion (+10.3%) on 41 million gallons (+2.5%). For 2024f, we are projecting sales of $3.5 billion (+9.4%) on 42 million gallons (+24%). Over time, however, we anticipate that the various factors that affect the use of automotive refinish coatings will begin to favor fewer accidents and other “need to repaint” scenarios, and that this market will begin trending downward at an estimated rate of 0.1-0.5% per year in volume during the period 2025-2030.
The industrial maintenance (I/M) and protective coatings market segment represented 39 million gallons valued at $1.9 billion in 2022, an increase from 2021 of 2.1% by volume and 22.5% by value. We are predicting an increase in volume of protective coatings of 2.1% and an increase in value of 12.3% in 2023e, representing 39.4 million gallons valued at $2.2 billion, driven largely by construction and infrastructure. Going into 2024f, we anticipate growth over 2023e of 6.2% to $2.3 billion in value and 2.3% growth in volume to 40.3 million gallons.
Overall Industry Expectations for the Paint and Coatings Market 2023e
At the end of the day, 2022 was a decent year for the U.S. coatings industry, despite the daily travails that were an unavoidable aspect of doing business for the entire year. Compared to 2021, sales were up 17.7% in value, even though volume decreased by 0.4%. Because pricing clearly outpaced volume, it is perhaps tempting to assume that coatings producers were able to keep ahead of raw material increases at an appropriate pace. While this may or may not be the case, it almost certainly varied on a producer-by-producer basis.
We estimate that 2023e will see an increase in value of the U.S. paint and coatings market by 5.3%, although volume will decrease by 1.5%. The total value of the U.S. market is expected to be $33.5 billion on 1.3 billion gallons in 2023e. The U.S. paint and coatings industry remains large and relatively healthy—and the outlook for 2024f suggests that growth will continue at a slightly faster pace than in 2023e. We currently foresee a 2.8% growth in volume and a 6.5% growth in value in 2024f, representing 1.34 billion gallons valued at $35.7 billion. Things are clearly headed “back to normal,” although it is unlikely to be the same “normal” that prevailed in 2019.
What About the "New Normal"?
As we look back to December 2019, all seemed “normal” when judged by historic performance, and then COVID-19 hit, with its lockdowns and a plunging economy. In 2022, as the world was trying to extricate itself from two years of chaos and get back to work, decades of creating complex supply chains suddenly—and dramatically—demonstrated the downside of complexity. Critical imports were not reaching U.S. ports, and, when they did, there was insufficient intermodal capacity to move those materials from ports to plants.
Demand quickly outpaced supply, and shipping prices rose as a result, which forced raw materials suppliers to increase their prices rapidly. In turn, coatings manufacturers were forced to raise their prices. The paint and coatings industry found itself enmeshed in a global supply chain crisis that virtually no one could have ever envisioned, even when projecting a worst-case scenario.
These are the conditions under which business in the United States experienced the transformation into a “new normal” characterized by many changes, both subtle and not-so-subtle, from the “old normal,” chief of which were the ongoing presence of moving targets in tactical and strategic planning, supply chains, research and development programs, market studies, availability of labor, wages and salaries, and the migration of workers at all levels from “the office” to “the home.” The remote workforce is an issue that has many tentacles, especially given that only about 50% of employees who made the move to a home office have moved back to “the office.”[8] Even the phrase “back in the office” is a moving target because it lacks the same meaning that it did pre-pandemic (e.g., number of days in the office vs. number of days of remote work, and the entire concept of “flexible scheduling”). While a lot has improved in 2023 over the previous three years, we are still faced with a number of moving targets that are making life complicated for everyone.
Strategic Planning is Mandatory for Dealing with Moving Targets
The principal value of history is that it generates lessons, typically along with an understanding of the tools and ideas needed to create a better future. For this reason, we must learn from “former normals” what worked, what failed to work, and why.
The global supply chain issues that have been experienced over the past 18 months were exposed by the global pandemic but were not caused by it. We have been living dangerously close to the edge for many years without acknowledging it.[6] Our global supply chains lack fundamental resilience, and, while they will appear to improve in 2023e and 2024f, it will only be 2025 or later that we will be able to determine what permanent changes were made and to what degree they were efficacious.
To varying degrees, some steps are certainly underway by individual governments and businesses within the manufacturing sector to bring greater resilience to the overall process. Much needs to be rethought, however, with regard to:
- Logistics, both intra-regional and global
- Ordering procedures—“Certainly ‘just-in-time’ (JIT) procurement practices are a thing of the past.”[9] JIT can only work for a single link in the value chain, and that has proven to be its “weak link.”
- Sourcing methods, both numerical and geographical
- Patterns and timing
- The relationship between “make and ship” and “make and hold”
- Cost of energy
- Many other aspects of the concept represented by the term “supply chain”
Most importantly of all, it should be our fervent hope that we have learned the value of having a business strategy. We cannot just talk about creating a strategy; we must create one for every business in the paint and coatings market supply chain.
It will be difficult for everyone to ignore the temptation to focus on tactical solutions for whatever problems with which the “new normal” presents us, because we must deliver the financial performance demanded by our investors. For the long-term good of our businesses, as well as the continued confidence of our investors, we absolutely must be using our recent history to guide the creation of a strategy that will move us “back from the edge” so that future surprise events will not have such a debilitating effect on our individual companies and on the U.S. economy in general.[6]
The concept of “moving targets” is not completely new—it was just elevated to a power during the past few years. U.S. industry has had to deal with moving targets when the various bubbles (e.g., housing, tech) burst, as well as during the various major recessions that occurred in the 1970s, 1980s, 1900s, and the Great Recession of 2008-2009. But a carefully considered and clearly articulated strategy for the future will enable raw material suppliers and coatings producers to weather, with significantly greater ease and effective results, whatever future “new normals” will come our way.
Going Forward
An effective strategy will be required to separate the winners from the losers. Full stop. Whether raw material and paint and coatings producers create their strategies and new products “in-house” or work with outside partners—strategic business advisers, technology consultants, independent laboratories, universities, or all four—meaningful strategy must be considered honestly, openly, carefully, and, most of all, seriously.
We live and work in a changing world, where in-house assets are increasingly challenged and easily overwhelmed, R&D pipelines are too long, tactical concerns relegate new product development to the back burner, and research staff is operating under the negative effects of stress. Consequently, strategic product development must either involve the expansion of current R&D staff or the use of outside know-how and expertise to augment internal efforts. Fortunately, it is both possible and profitable to take this latter approach, but overcoming “NIH Syndrome” (“not invented here”) is not always easy to accomplish. For those raw material and coatings producers who are able to do so, however, the rewards have proven to be significant.
Independent third-party individuals, strategic consulting firms, and technology organizations are able to bring extensive knowledge in multiple fields of specialty chemicals to bear on the advancement and cross-fertilization of technology at both raw material suppliers and coatings producers. This approach is well worth doing “whatever it takes” to rid manufacturing companies of NIH Syndrome and embrace a wider world of technology experience and know-how.
To learn more, contact the author at gpilcher@chemquest.com.
Read in CoatingsTech.
References
1. Zhang, E.; Yao, K. China’s Economy Slows in May, More Stimulus Expected. Reuters, June 15, 2023. https://www.reuters.com/world/china/chinas-economy-slows-further-may-weak-demand-drags-2023-06-15/ (accessed July 19, 2023).
2. “US Utilization of Refinery Capacity (I:USURCNW), YCharts. https://ycharts.com/indicators/us_operable_crude_oil_distillation_capacity (accessed July 19, 2023).
3. “LyondellBasell Pushes Back Houston Oil Refinery Closure.” Hart Energy, June 2, 2023. https://www.hartenergy.com/exclusives/lyondellbasell-pushes-back-houston-oil-refinery-closure-205293 (accessed July 19, 2023).
4. “Chemical Sector Profile.” Cybersecurity & Infrastructure Security Agency, March 2022. https://www.cisa.gov/sites/default/files/2023-02/chemical_sector_profile_final_508_2022_0.pdf (accessed July 19, 2023).
5. American Coatings Association. Industry Pulse: Industrial Coatings, 2022 Q2, July 5, 2022.
6. Pilcher, G.R. “The State of the U.S. Coatings Industry 2022: The Confluence of High Demand, Restricted Supply, Rising Inflation, Labor Shortages, and Cash Flow Issues,” CoatingsTech, 2022, 19(7), 35-42.
7. Bureau of Economic Analysis. https://www.bea.gov/ (accessed July 20, 2023).
8. Telford, T. “America’s offices are now half-full. They may not get much fuller,” The Washington Post, February 4, 2023. https://www.washingtonpost.com/business/2023/02/04/return-to-office-occupancy-status/ (accessed July 19, 2023).
9. Abrams, E. F. “The View from the Other Side,” Polymers Paint Colour Journal, June 2022, 10-11.